Shaw 2009 Annual Report Download - page 41
Download and view the complete annual report
Please find page 41 of the 2009 Shaw annual report below. You can navigate through the pages in the report by either clicking on the pages listed below, or by using the keyword search tool below to find specific information within the annual report.-
 1
1 -
2
-
3
-
4
-
5
-
6
-
7
-
8
-
9
-
10
-
11
-
12
-
13
-
14
-
15
-
16
-
17
-
18
-
19
-
20
-
21
-
22
-
23
-
24
-
25
-
26
-
27
-
28
-
29
-
30
-
 31
31 -
 32
32 -
 33
33 -
 34
34 -
 35
35 -
 36
36 -
 37
37 -
 38
38 -
 39
39 -
 40
40 -
 41
41 -
 42
42 -
 43
43 -
 44
44 -
 45
45 -
 46
46 -
 47
47 -
 48
48 -
 49
49 -
 50
50 -
 51
51 -
52
-
53
-
54
-
55
-
56
-
57
-
58
-
59
-
60
-
61
-
62
-
63
-
64
-
65
-
66
-
67
-
68
-
69
-
70
-
71
-
72
-
73
-
74
-
75
-
76
-
77
-
78
-
79
-
80
-
81
-
82
-
83
-
84
-
85
-
86
-
87
-
88
-
89
-
90
-
91
-
92
-
93
-
94
-
95
-
96
-
97
-
98
-
99
-
100
-
101
-
102
-
103
-
104
-
105
-
106
-
107
-
108
-
109
-
110
-
111
-
112
-
113
 |
 |

kThe initial product launch of Shaw Digital Phone service was in Calgary on February 14,
2005. Since this initial launch Shaw has continued to expand its Digital Phone service
area and at the end of fiscal 2009 the service was available to 94% of Basic
subscribers.
kIn late October 2008 Shaw launched a new Digital rental program and is focusing on
growing its Digital customer base over the next several years.
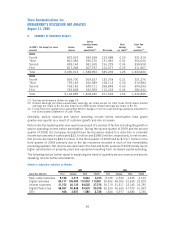
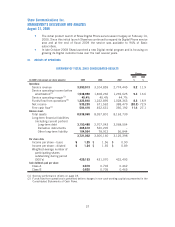
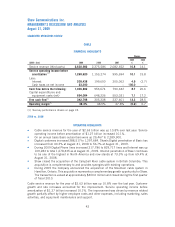
III. RESULTS OF OPERATIONS
OVERVIEW OF FISCAL 2009 CONSOLIDATED RESULTS
(In $000’s Cdn except per share amounts) 2009 2008 2007
2009
%
2008
%
Change
Operations:
Service revenue 3,390,913 3,104,859 2,774,445 9.2 11.9
Service operating income before
amortization
(1)
1,538,950 1,408,236 1,239,625 9.3 13.6
Service operating margin
(1)
45.4% 45.4% 44.7%
Funds flow from operations
(2)
1,323,840 1,222,895 1,028,363 8.3 18.9
Net income 535,239 671,562 388,479 (20.3) 72.9
Free cash flow
(1)
504,416 452,631 356,192 11.4 27.1
Balance sheet:
Total assets 8,938,069 8,357,801 8,163,739
Long-term financial liabilities
(including current portion)
Long-term debt 3,150,488 2,707,043 3,068,554
Derivative instruments 465,610 520,205 –
Other long-term liability 104,964 78,912 56,844
3,721,062 3,306,160 3,125,398
Per share data:
Income per share – basic $ 1.25 $ 1.56 $ 0.90
Income per share – diluted $ 1.24 $ 1.55 $ 0.89
Weighted average number of
participating shares
outstanding during period
(000’s) 429,153 431,070 432,493
Cash dividends paid per share
Class A 0.818 0.702 0.462
Class B 0.820 0.705 0.465
(1) See key performance drivers on page 18.
(2) Funds flow from operations is presented before changes in non-cash working capital as presented in the
Consolidated Statements of Cash Flows.
37
Shaw Communications Inc.
MANAGEMENT’S DISCUSSION AND ANALYSIS
August 31, 2009