Shaw 2009 Annual Report Download - page 53
Download and view the complete annual report
Please find page 53 of the 2009 Shaw annual report below. You can navigate through the pages in the report by either clicking on the pages listed below, or by using the keyword search tool below to find specific information within the annual report.-
 1
1 -
2
-
3
-
4
-
5
-
6
-
7
-
8
-
9
-
10
-
11
-
12
-
13
-
14
-
15
-
16
-
17
-
18
-
19
-
20
-
21
-
22
-
23
-
24
-
25
-
26
-
27
-
28
-
29
-
30
-
31
-
32
-
33
-
34
-
35
-
36
-
37
-
38
-
39
-
40
-
41
-
42
-
 43
43 -
 44
44 -
 45
45 -
 46
46 -
 47
47 -
 48
48 -
 49
49 -
 50
50 -
 51
51 -
 52
52 -
 53
53 -
 54
54 -
 55
55 -
 56
56 -
 57
57 -
 58
58 -
 59
59 -
 60
60 -
 61
61 -
 62
62 -
 63
63 -
64
-
65
-
66
-
67
-
68
-
69
-
70
-
71
-
72
-
73
-
74
-
75
-
76
-
77
-
78
-
79
-
80
-
81
-
82
-
83
-
84
-
85
-
86
-
87
-
88
-
89
-
90
-
91
-
92
-
93
-
94
-
95
-
96
-
97
-
98
-
99
-
100
-
101
-
102
-
103
-
104
-
105
-
106
-
107
-
108
-
109
-
110
-
111
-
112
-
113
 |
 |

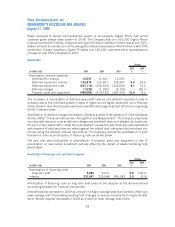
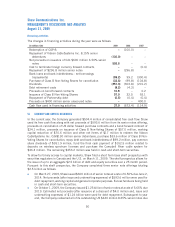
Share capital increased by $50.4 million primarily due to the issuance of 3,488,130 Class B Non-
Voting Shares under the Company’s option plans for $59.0 million partially offset by the repurchase
of 1,683,000 Class B Non-Voting Shares for $33.6 million of which $8.6 million reduced stated
share capital and $25.0 million was charged against retained earnings. As of November 24, 2009,
share capital is as reported at August 31, 2009 with the exception of the issuance of 441,618
Class B Non-Voting Shares upon exercise of options subsequent to the year end and issuance of
6,141,250 Class B Non-Voting Shares in respect of the acquisition of Mountain Cable in Hamilton.
Contributed surplus increased due to stock-based compensation expense recorded in the current
year. Accumulated other comprehensive loss decreased primarily due to a decline in the unrealized
losses on derivative instruments related to US denominated long-term debt.
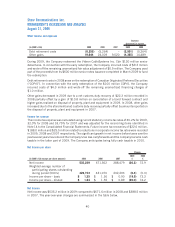
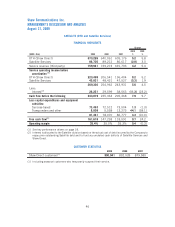
V. CONSOLIDATED CASH FLOW ANALYSIS
Operating activities
(In $000’s Cdn) 2009 2008 2007
2009
%
2008
%
Change
Funds flow from operations 1,323,840 1,222,895 1,028,363 8.3 18.9
Net decrease (increase) in non-
cash working capital balances
related to operations 59,090 19,304 (28,350) 206.1 168.1
1,382,930 1,242,199 1,000,013 11.3 24.2
Funds flow from operations increased year-over-year due to growth in service operating income
before amortization which was partially offset by current income tax expense in 2009. The
year-over-year net change in non-cash working capital balances is primarily due to timing of
collection of accounts receivable and payment of accounts payable and accrued liabilities in
addition to the provision for current taxes payable in 2009 as the Company became cash taxable.
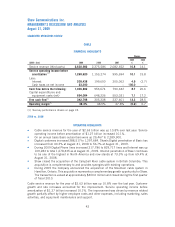
Investing activities
(In $000’s Cdn) 2009 2008 2007 2009 2008
Increase
Cash flow used in investing
activities (966,716) (734,135) (719,777) (232,581) (14,358)
In 2009, the primary uses of cash for investing activities were capital expenditures and equipment
costs (net) of $802.9 million, final deposits for wireless spectrum licenses of $152.5 million and
the acquisition of the Campbell River cable system of $46.3 million, all of which were partially
offset by proceeds on disposal of property, plant and equipment of $22.1 million and proceeds on
cancellation of certain US dollar forward purchase contracts of $13.4 million.
In 2008, the primary uses of cash for investing activities were capital expenditures and equipment
costs (net) of $727.4 million and deposits for wireless spectrum licenses of $38.4 million, both of
which were partially offset by a net customs duty recovery of $22.3 million.
49
Shaw Communications Inc.
MANAGEMENT’S DISCUSSION AND ANALYSIS
August 31, 2009