Shaw 2009 Annual Report Download - page 110
Download and view the complete annual report
Please find page 110 of the 2009 Shaw annual report below. You can navigate through the pages in the report by either clicking on the pages listed below, or by using the keyword search tool below to find specific information within the annual report.-
 1
1 -
2
-
3
-
4
-
5
-
6
-
7
-
8
-
9
-
10
-
11
-
12
-
13
-
14
-
15
-
16
-
17
-
18
-
19
-
20
-
21
-
22
-
23
-
24
-
25
-
26
-
27
-
28
-
29
-
30
-
31
-
32
-
33
-
34
-
35
-
36
-
37
-
38
-
39
-
40
-
41
-
42
-
43
-
44
-
45
-
46
-
47
-
48
-
49
-
50
-
51
-
52
-
53
-
54
-
55
-
56
-
57
-
58
-
59
-
60
-
61
-
62
-
63
-
64
-
65
-
66
-
67
-
68
-
69
-
70
-
71
-
72
-
73
-
74
-
75
-
76
-
77
-
78
-
79
-
80
-
81
-
82
-
83
-
84
-
85
-
86
-
87
-
88
-
89
-
90
-
91
-
92
-
93
-
94
-
95
-
96
-
97
-
98
-
99
-
 100
100 -
 101
101 -
 102
102 -
 103
103 -
 104
104 -
 105
105 -
 106
106 -
 107
107 -
 108
108 -
 109
109 -
 110
110 -
 111
111 -
 112
112 -
 113
113
 |
 |

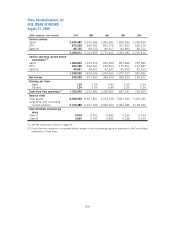
Shaw Communications Inc.
FIVE YEARS IN REVIEW
August 31, 2009
($000’s except per share amounts) 2009 2008 2007 2006 2005
Service revenue
Cable 2,630,982 2,375,586 2,082,652 1,808,583 1,598,369
DTH 673,226 640,061 605,176 567,807 530,729
Satellite 86,705 89,212 86,617 82,894 80,712
3,390,913 3,104,859 2,774,445 2,459,284 2,209,810
Service operating income before
amortization
(1)
Cable 1,269,620 1,153,274 995,694 857,466 797,583
DTH 223,499 206,541 196,404 175,401 141,687
Satellite 45,831 48,421 47,527 45,050 42,723
1,538,950 1,408,236 1,239,625 1,077,917 981,993
Net income 535,239 671,562 388,479 458,250 153,221
Earnings per share
Basic 1.25 1.56 0.90 1.05 0.34
Diluted 1.24 1.55 0.89 1.05 0.34
Funds flow from operations
(2)
1,323,840 1,222,895 1,028,363 847,197 728,524
Balance sheet
Total assets 8,938,069 8,357,801 8,163,739 7,661,543 7,430,185
Long-term debt (including
current portion) 3,150,488 2,707,043 3,068,554 2,996,385 3,199,542
Cash dividends declared per
share
Class A 0.818 0.702 0.462 0.235 0.153
Class B 0.820 0.705 0.465 0.238 0.155
(1) See key performance drivers on page 18.
(2) Funds flow from operations is presented before changes in non-cash working capital as presented in the Consolidated
Statements of Cash Flows.
106