Shaw 2009 Annual Report Download - page 22
Download and view the complete annual report
Please find page 22 of the 2009 Shaw annual report below. You can navigate through the pages in the report by either clicking on the pages listed below, or by using the keyword search tool below to find specific information within the annual report.-
 1
1 -
2
-
3
-
4
-
5
-
6
-
7
-
8
-
9
-
10
-
11
-
 12
12 -
 13
13 -
 14
14 -
 15
15 -
 16
16 -
 17
17 -
 18
18 -
 19
19 -
 20
20 -
 21
21 -
 22
22 -
 23
23 -
 24
24 -
 25
25 -
 26
26 -
 27
27 -
 28
28 -
 29
29 -
 30
30 -
 31
31 -
 32
32 -
33
-
34
-
35
-
36
-
37
-
38
-
39
-
40
-
41
-
42
-
43
-
44
-
45
-
46
-
47
-
48
-
49
-
50
-
51
-
52
-
53
-
54
-
55
-
56
-
57
-
58
-
59
-
60
-
61
-
62
-
63
-
64
-
65
-
66
-
67
-
68
-
69
-
70
-
71
-
72
-
73
-
74
-
75
-
76
-
77
-
78
-
79
-
80
-
81
-
82
-
83
-
84
-
85
-
86
-
87
-
88
-
89
-
90
-
91
-
92
-
93
-
94
-
95
-
96
-
97
-
98
-
99
-
100
-
101
-
102
-
103
-
104
-
105
-
106
-
107
-
108
-
109
-
110
-
111
-
112
-
113
 |
 |

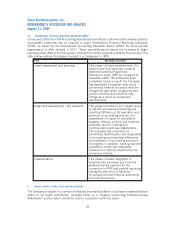
F. Key performance drivers
Shaw measures the success of its strategies using a number of key performance drivers which are
outlined below, including a discussion as to their relevance, definitions, calculation methods and
underlying assumptions.
FINANCIAL MEASURES:
i) Service revenue
Service revenue is a measurement determined in accordance with Canadian and US generally
accepted accounting principles (“GAAP”). It represents the inflow of cash, receivables or other
consideration arising from the sale of products and services. Service revenue is net of items such as
trade or volume discounts and certain excise and sales taxes. It is the base on which free cash flow, a
key performance driver, is determined; therefore, it measures the potential to deliver free cash flow
as well as indicating growth in a competitive market place.
The Company’s continuous disclosure documents may provide discussion and analysis of non-GAAP
financial measures. These financial measures do not have standard definitions prescribed by Canadian
or US GAAP and therefore may not be comparable to similar measures disclosed by other companies. The
Company utilizes these measures in making operating decisions and assessing its performance. Certain
investors, analysts and others utilize these measures in assessing the Company’s financial performance
and as an indicator of its ability to service debt and return cash to shareholders. These non-GAAP
measures have not been presented as an alternative to net income or any other measure of performance
or liquidity prescribed by Canadian or US GAAP. The following contains a listing of the Company’s use of
non-GAAP financial measures and provides a reconciliation to the nearest GAAP measurement or
provides a reference to such reconciliation.
ii) Service operating income before amortization and operating margin
Service operating income before amortization is calculated as service revenue less operating,
general and administrative expenses and is presented as a sub-total line item in the Consolidated
Statements of Income and Retained Earnings (Deficit). It is intended to indicate the Company’s
ability to service and/or incur debt, and therefore it is calculated before amortization (a non-cash
expense) and interest. Service operating income before amortization is also one of the measures
used by the investing community to value the business. Operating margin is calculated by dividing
service operating income before amortization by service revenue.
Relative increases period over period in service operating income before amortization and in
operating margin are indicative of the Company’s success in delivering valued products and services
to its customers in a cost-effective manner.
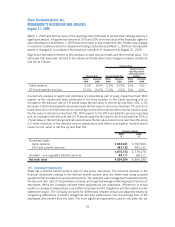
iii) Free cash flow
The Company uses free cash flow as a measure of the Company’s ability to repay debt and return
cash to shareholders. Consolidated free cash flow is calculated as follows:
($000’s Cdn) 2009 2008 2007
Cable free cash flow
(1)
342,798 305,338 237,601
Satellite free cash flow
(2)
161,618 147,293 118,591
Consolidated free cash flow 504,416 452,631 356,192
(1) The reconciliation of free cash flow for cable is provided on page 42.
(2) The reconciliation of free cash flow for satellite is provided on page 46.
18
Shaw Communications Inc.
MANAGEMENT’S DISCUSSION AND ANALYSIS
August 31, 2009