Shaw 2009 Annual Report Download - page 62
Download and view the complete annual report
Please find page 62 of the 2009 Shaw annual report below. You can navigate through the pages in the report by either clicking on the pages listed below, or by using the keyword search tool below to find specific information within the annual report.-
 1
1 -
2
-
3
-
4
-
5
-
6
-
7
-
8
-
9
-
10
-
11
-
12
-
13
-
14
-
15
-
16
-
17
-
18
-
19
-
20
-
21
-
22
-
23
-
24
-
25
-
26
-
27
-
28
-
29
-
30
-
31
-
32
-
33
-
34
-
35
-
36
-
37
-
38
-
39
-
40
-
41
-
42
-
43
-
44
-
45
-
46
-
47
-
48
-
49
-
50
-
51
-
 52
52 -
 53
53 -
 54
54 -
 55
55 -
 56
56 -
 57
57 -
 58
58 -
 59
59 -
 60
60 -
 61
61 -
 62
62 -
 63
63 -
 64
64 -
 65
65 -
 66
66 -
 67
67 -
 68
68 -
 69
69 -
 70
70 -
 71
71 -
 72
72 -
73
-
74
-
75
-
76
-
77
-
78
-
79
-
80
-
81
-
82
-
83
-
84
-
85
-
86
-
87
-
88
-
89
-
90
-
91
-
92
-
93
-
94
-
95
-
96
-
97
-
98
-
99
-
100
-
101
-
102
-
103
-
104
-
105
-
106
-
107
-
108
-
109
-
110
-
111
-
112
-
113
 |
 |

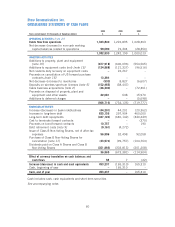
Shaw Communications Inc.
CONSOLIDATED STATEMENTS OF INCOME AND RETAINED EARNINGS (DEFICIT)
Years ended August 31 [thousands of Canadian dollars
except per share amounts]
2009
$
2008
$
2007
$
Service revenue [note 15] 3,390,913 3,104,859 2,774,445
Operating, general and administrative expenses 1,851,963 1,696,623 1,534,820
Service operating income before amortization
[note 15] 1,538,950 1,408,236 1,239,625
Amortization –
Deferred IRU revenue [note 10] 12,547 12,547 12,547
Deferred equipment revenue [note 10] 132,974 126,601 104,997
Deferred equipment costs [note 7] (247,110) (228,524) (203,597)
Deferred charges [note 7] (1,025) (1,025) (5,153)
Property, plant and equipment [note 6] (480,582) (414,732) (381,909)
Operating income 955,754 903,103 766,510
Amortization of financing costs – long-term
debt [note 9] (3,984) (3,627) –
Interest [notes 7, 9, 10 and 13] (237,047) (230,588) (245,043)
714,723 668,888 521,467
Debt retirement costs [note 9] (8,255) (5,264) –
Other gains [note 1] 19,644 24,009 9,520
Income before income taxes 726,112 687,633 530,987
Income tax expense [note 14] 190,774 16,366 142,871
Income before the following 535,338 671,267 388,116
Equity income (loss) on investee (99) 295 363
Net income 535,239 671,562 388,479
Retained earnings (deficit), beginning of year 226,408 (68,132) (172,701)
Adjustment for adoption of new accounting
policy [note 1] –1,754 –
Reduction on Class B Non-Voting Shares
purchased for cancellation [note 11] (25,017) (74,963) (82,702)
Dividends – Class A Shares and Class B Non-
Voting Shares (351,883) (303,813) (201,208)
Retained earnings (deficit), end of year 384,747 226,408 (68,132)
Earnings per share [note 11]
Basic $ 1.25 $ 1.56 $ 0.90
Diluted $ 1.24 $ 1.55 $ 0.89
See accompanying notes
58