Shaw 2009 Annual Report Download - page 89
Download and view the complete annual report
Please find page 89 of the 2009 Shaw annual report below. You can navigate through the pages in the report by either clicking on the pages listed below, or by using the keyword search tool below to find specific information within the annual report.-
 1
1 -
2
-
3
-
4
-
5
-
6
-
7
-
8
-
9
-
10
-
11
-
12
-
13
-
14
-
15
-
16
-
17
-
18
-
19
-
20
-
21
-
22
-
23
-
24
-
25
-
26
-
27
-
28
-
29
-
30
-
31
-
32
-
33
-
34
-
35
-
36
-
37
-
38
-
39
-
40
-
41
-
42
-
43
-
44
-
45
-
46
-
47
-
48
-
49
-
50
-
51
-
52
-
53
-
54
-
55
-
56
-
57
-
58
-
59
-
60
-
61
-
62
-
63
-
64
-
65
-
66
-
67
-
68
-
69
-
70
-
71
-
72
-
73
-
74
-
75
-
76
-
77
-
78
-
 79
79 -
 80
80 -
 81
81 -
 82
82 -
 83
83 -
 84
84 -
 85
85 -
 86
86 -
 87
87 -
 88
88 -
 89
89 -
 90
90 -
 91
91 -
 92
92 -
 93
93 -
 94
94 -
 95
95 -
 96
96 -
 97
97 -
 98
98 -
 99
99 -
100
-
101
-
102
-
103
-
104
-
105
-
106
-
107
-
108
-
109
-
110
-
111
-
112
-
113
 |
 |

Cable
$
DTH
$
Satellite Services
$
Total
$
Total
$
Satellite
2008
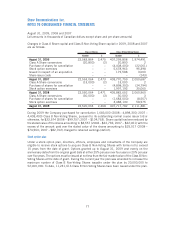
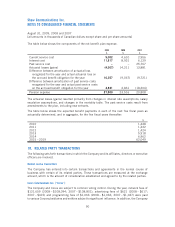
Service revenue – total 2,379,361 650,653 92,712 743,365 3,122,726
Intersegment (3,775) (10,592) (3,500) (14,092) (17,867)
2,375,586 640,061 89,212 729,273 3,104,859
Service operating income before amortization 1,153,274 206,541 48,421 254,962 1,408,236
Service operating income as % of external
revenue 48.5% 32.3% 54.3% 35.0% 45.4%
Interest
(1)
199,600 n/a n/a 29,599 229,199
Burrard Landing Lot 2 Holdings Partnership 1,389
230,588
Cash taxes
(1)
–– – – –
Segment assets 6,465,183 869,710 523,736 1,393,446 7,858,629
Corporate assets 499,172
Total assets 8,357,801
Capital expenditures and equipment costs (net)
by segment
Capital expenditures 602,848 2,997 (766) 2,231 605,079
Equipment costs (net) 45,488 75,839 – 75,839 121,327
648,336 78,836 (766) 78,070 726,406
Reconciliation to Consolidated Statements of
Cash Flows
Additions to property, plant and equipment 606,093
Additions to equipment costs (net) 121,327
Total of capital expenditures and equipment
costs (net) per Consolidated Statements of
Cash Flows 727,420
Increase in working capital related to capital
expenditures 2,608
Less: Satellite services equipment profit
(4)
(3,622)
Total capital expenditures and equipment
costs (net) reported by segments 726,406
See notes following 2007 business segment table.
85
Shaw Communications Inc.
NOTES TO CONSOLIDATED FINANCIAL STATEMENTS
August 31, 2009, 2008 and 2007
[all amounts in thousands of Canadian dollars except share and per share amounts]