Shaw 2009 Annual Report Download - page 46
Download and view the complete annual report
Please find page 46 of the 2009 Shaw annual report below. You can navigate through the pages in the report by either clicking on the pages listed below, or by using the keyword search tool below to find specific information within the annual report.-
 1
1 -
2
-
3
-
4
-
5
-
6
-
7
-
8
-
9
-
10
-
11
-
12
-
13
-
14
-
15
-
16
-
17
-
18
-
19
-
20
-
21
-
22
-
23
-
24
-
25
-
26
-
27
-
28
-
29
-
30
-
31
-
32
-
33
-
34
-
35
-
 36
36 -
 37
37 -
 38
38 -
 39
39 -
 40
40 -
 41
41 -
 42
42 -
 43
43 -
 44
44 -
 45
45 -
 46
46 -
 47
47 -
 48
48 -
 49
49 -
 50
50 -
 51
51 -
 52
52 -
 53
53 -
 54
54 -
 55
55 -
 56
56 -
57
-
58
-
59
-
60
-
61
-
62
-
63
-
64
-
65
-
66
-
67
-
68
-
69
-
70
-
71
-
72
-
73
-
74
-
75
-
76
-
77
-
78
-
79
-
80
-
81
-
82
-
83
-
84
-
85
-
86
-
87
-
88
-
89
-
90
-
91
-
92
-
93
-
94
-
95
-
96
-
97
-
98
-
99
-
100
-
101
-
102
-
103
-
104
-
105
-
106
-
107
-
108
-
109
-
110
-
111
-
112
-
113
 |
 |

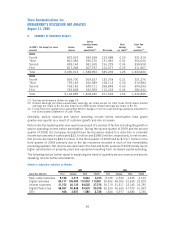
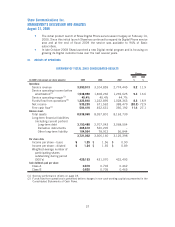
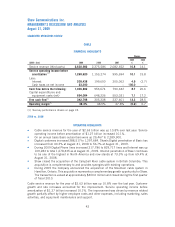
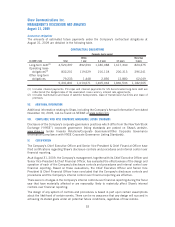
SEGMENTED OPERATIONS REVIEW
CABLE
FINANCIAL HIGHLIGHTS
($000’s Cdn) 2009 2008 2007
2009
%
2008
%
Change
Service revenue (third party) 2,630,982 2,375,586 2,082,652 10.8 14.1
Service operating income before
amortization
(1)
1,269,620 1,153,274 995,694 10.1 15.8
Less:
Interest 209,438 199,600 205,062 4.9 (2.7)
Cash taxes on net income 23,300 ––100.0 –
Cash flow before the following: 1,036,882 953,674 790,632 8.7 20.6
Capital expenditures and
equipment costs (net) 694,084 648,336 553,031 7.1 17.2
Free cash flow
(1)
342,798 305,338 237,601 12.3 28.5
Operating margin
(1)
48.3% 48.5% 47.8% (0.2) 0.7
(1) See key performance drivers on page 18.
2009 vs. 2008
OPERATING HIGHLIGHTS
kCable service revenue for the year of $2.63 billion was up 10.8% over last year. Service
operating income before amortization of $1.27 billion increased 10.1%.
kOn an annual basis Basic subscribers were up 29,467 to 2,289,900.
kDigital customers increased 388,517 to 1,297,684. Shaw’s Digital penetration of Basic has
increased from 40.2% at August 31, 2008 to 56.7% at August 31, 2009.
kDuring 2009 Digital Phone lines increased 217,786 to 829,717 lines and Internet was up
109,283 to total 1,678,335 as at August 31, 2009. Internet penetration of Basic continues
to be one of the highest in North America and now stands at 73.3% up from 69.4% at
August 31, 2008.
kShaw closed the acquisition of the Campbell River cable system in British Columbia. This
acquisition is complementary to and provides synergies with existing operations.
kDuring 2009 the Company announced the acquisition of the Mountain cable system in
Hamilton, Ontario. This acquisition represents a complementary growth opportunity for Shaw.
The transaction is valued at approximately $300.0 million and closed during the first quarter
of fiscal 2010.
Cable service revenue for the year of $2.63 billion was up 10.8% over the last year. Customer
growth and rate increases accounted for the improvement. Service operating income before
amortization of $1.27 billion increased 10.1%. The improvement was driven by revenue related
growth partially offset by higher employee costs and other expenses, including marketing, sales
activities, and equipment maintenance and support.
42
Shaw Communications Inc.
MANAGEMENT’S DISCUSSION AND ANALYSIS
August 31, 2009