Shaw 2009 Annual Report Download - page 50
Download and view the complete annual report
Please find page 50 of the 2009 Shaw annual report below. You can navigate through the pages in the report by either clicking on the pages listed below, or by using the keyword search tool below to find specific information within the annual report.-
 1
1 -
2
-
3
-
4
-
5
-
6
-
7
-
8
-
9
-
10
-
11
-
12
-
13
-
14
-
15
-
16
-
17
-
18
-
19
-
20
-
21
-
22
-
23
-
24
-
25
-
26
-
27
-
28
-
29
-
30
-
31
-
32
-
33
-
34
-
35
-
36
-
37
-
38
-
39
-
 40
40 -
 41
41 -
 42
42 -
 43
43 -
 44
44 -
 45
45 -
 46
46 -
 47
47 -
 48
48 -
 49
49 -
 50
50 -
 51
51 -
 52
52 -
 53
53 -
 54
54 -
 55
55 -
 56
56 -
 57
57 -
 58
58 -
 59
59 -
 60
60 -
61
-
62
-
63
-
64
-
65
-
66
-
67
-
68
-
69
-
70
-
71
-
72
-
73
-
74
-
75
-
76
-
77
-
78
-
79
-
80
-
81
-
82
-
83
-
84
-
85
-
86
-
87
-
88
-
89
-
90
-
91
-
92
-
93
-
94
-
95
-
96
-
97
-
98
-
99
-
100
-
101
-
102
-
103
-
104
-
105
-
106
-
107
-
108
-
109
-
110
-
111
-
112
-
113
 |
 |

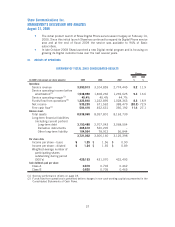
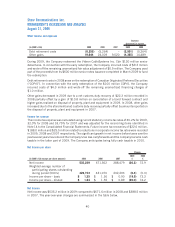
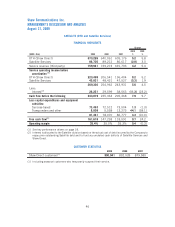
SATELLITE (DTH and Satellite Services)
FINANCIAL HIGHLIGHTS
($000’s Cdn) 2009 2008 2007
2009
%
2008
%
Change
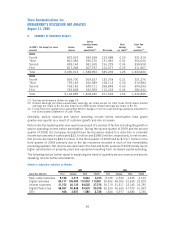
DTH (Shaw Direct) 673,226 640,061 605,176 5.2 5.8
Satellite Services 86,705 89,212 86,617 (2.8) 3.0
Service revenue (third party) 759,931 729,273 691,793 4.2 5.4
Service operating income before
amortization
(1)
DTH (Shaw Direct) 223,499 206,541 196,404 8.2 5.2
Satellite Services 45,831 48,421 47,527 (5.3) 1.9
269,330 254,962 243,931 5.6 4.5
Less:
Interest
(2)
26,251 29,599 38,563 (11.3) (23.2)
Cash flow before the following 243,079 225,363 205,368 7.9 9.7
Less capital expenditures and equipment
subsidies:
Success-based 73,453 72,512 73,504 1.3 (1.3)
Transponders and other 8,008 5,558 13,273 44.1 (58.1)
81,461 78,070 86,777 4.3 (10.0)
Free cash flow
(1)
161,618 147,293 118,591 9.7 24.2
Operating margin 35.4% 35.0% 35.3% 0.4 (0.3)
(1) See key performance drivers on page 18.
(2) Interest is allocated to the Satellite division based on the actual cost of debt incurred by the Company to
repay prior outstanding Satellite debt and to fund accumulated cash deficits of Satellite Services and
Shaw Direct.
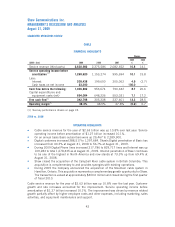
CUSTOMER STATISTICS
2009 2008 2007
Shaw Direct customers
(1)
900,941 892,528 879,585
(1) Including seasonal customers who temporarily suspend their service.
46
Shaw Communications Inc.
MANAGEMENT’S DISCUSSION AND ANALYSIS
August 31, 2009