Shaw 2009 Annual Report Download - page 49
Download and view the complete annual report
Please find page 49 of the 2009 Shaw annual report below. You can navigate through the pages in the report by either clicking on the pages listed below, or by using the keyword search tool below to find specific information within the annual report.-
 1
1 -
2
-
3
-
4
-
5
-
6
-
7
-
8
-
9
-
10
-
11
-
12
-
13
-
14
-
15
-
16
-
17
-
18
-
19
-
20
-
21
-
22
-
23
-
24
-
25
-
26
-
27
-
28
-
29
-
30
-
31
-
32
-
33
-
34
-
35
-
36
-
37
-
38
-
 39
39 -
 40
40 -
 41
41 -
 42
42 -
 43
43 -
 44
44 -
 45
45 -
 46
46 -
 47
47 -
 48
48 -
 49
49 -
 50
50 -
 51
51 -
 52
52 -
 53
53 -
 54
54 -
 55
55 -
 56
56 -
 57
57 -
 58
58 -
 59
59 -
60
-
61
-
62
-
63
-
64
-
65
-
66
-
67
-
68
-
69
-
70
-
71
-
72
-
73
-
74
-
75
-
76
-
77
-
78
-
79
-
80
-
81
-
82
-
83
-
84
-
85
-
86
-
87
-
88
-
89
-
90
-
91
-
92
-
93
-
94
-
95
-
96
-
97
-
98
-
99
-
100
-
101
-
102
-
103
-
104
-
105
-
106
-
107
-
108
-
109
-
110
-
111
-
112
-
113
 |
 |

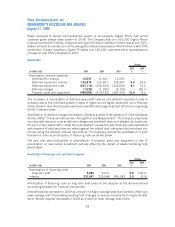
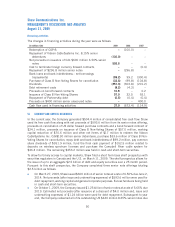
Investment in Buildings and other declined $41.7 million compared to the prior year. The lower
spend was primarily due to higher investment last year in various facilities projects, including the
purchase of a property in Calgary adjacent to existing Company owned facilities, partially offset by
increased investment in the current year on IT projects to upgrade back office and customer support
systems. The current year also benefitted from proceeds on the sale of redundant facilities.
2008 vs. 2007
Total capital investment for 2008 of $648.3 million increased $95.3 million over the comparable
period.
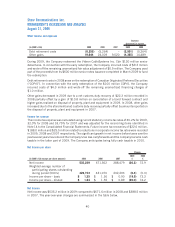
Investment in Buildings and Other increased $41.7 million primarily due to investments in various
facilities projects to support growth, including a purchase of land and buildings, new facilities
construction, and building renovations. The land and buildings purchased in 2008 are located
immediately adjacent to other Company-owned facilities in Calgary, Alberta and will allow for the
consolidation of various operating groups located in other areas of the city at one campus style
location.
Success-based capital increased $20.5 million over 2007. Digital success-based capital was up as
a result of reduced customer pricing on certain digital equipment and higher sales volume. Digital
Phone success-based capital also increased mainly due to customer growth. Internet success-
based capital was up mainly due to reduced customer pricing on modems.
Replacement and Upgrades and enhancement categories combined were up $29.5 million over
2007. These increased investments continue to expand plant capacity to support customer growth
and increasing usage demands.
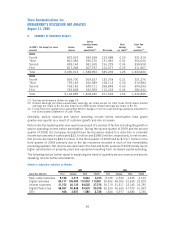
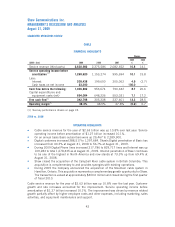
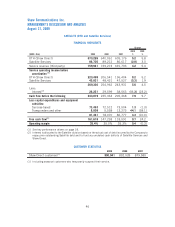
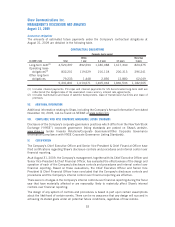
SUBSCRIBER STATISTICS
2009 2008
(1)
2007
(1)
Growth
Change
% Growth
Change
%
2009 2008
CABLE:
Basic subscribers 2,289,900 2,260,433 2,239,154 29,467 1.3 21,279 1.0
Penetration as a % of homes
passed 62.8% 63.5% 64.6%
Digital customers 1,297,684 909,167 765,987 388,517 42.7 143,180 18.7
INTERNET:
Connected and scheduled
installations 1,678,335 1,569,052 1,454,846 109,283 7.0 114,206 7.9
Penetration as % of basic 73.3% 69.4% 65.0%
Stand-alone Internet not
included in basic cable 235,686 214,315 182,757 21,371 10.0 31,558 17.3
DIGITAL PHONE:
Number of lines
(2)
829,717 611,931 385,357 217,786 35.6 226,574 58.8
(1) August 31, 2007 and August 31, 2008 are restated for comparative purposes as if the acquisition of the
Campbell River cable system in British Columbia had occurred on that date.
(2) Represents primary and secondary lines on billing plus pending installs.
45
Shaw Communications Inc.
MANAGEMENT’S DISCUSSION AND ANALYSIS
August 31, 2009