Samsung 2006 Annual Report Download - page 99
Download and view the complete annual report
Please find page 99 of the 2006 Samsung annual report below. You can navigate through the pages in the report by either clicking on the pages listed below, or by using the keyword search tool below to find specific information within the annual report.-
 1
1 -
2
-
3
-
4
-
5
-
6
-
7
-
8
-
9
-
10
-
11
-
12
-
13
-
14
-
15
-
16
-
17
-
18
-
19
-
20
-
21
-
22
-
23
-
24
-
25
-
26
-
27
-
28
-
29
-
30
-
31
-
32
-
33
-
34
-
35
-
36
-
37
-
38
-
39
-
40
-
41
-
42
-
43
-
44
-
45
-
46
-
47
-
48
-
49
-
50
-
51
-
52
-
53
-
54
-
55
-
56
-
57
-
58
-
59
-
60
-
61
-
62
-
63
-
64
-
65
-
66
-
67
-
68
-
69
-
70
-
71
-
72
-
73
-
74
-
75
-
76
-
77
-
78
-
79
-
80
-
81
-
82
-
83
-
84
-
85
-
86
-
87
-
88
-
 89
89 -
 90
90 -
 91
91 -
 92
92 -
 93
93 -
 94
94 -
 95
95 -
 96
96 -
 97
97 -
 98
98 -
 99
99 -
 100
100 -
 101
101 -
 102
102 -
 103
103 -
 104
104 -
 105
105 -
 106
106 -
 107
107 -
 108
108 -
 109
109 -
110
-
111
-
112
-
113
-
114
-
115
-
116
-
117
-
118
-
119
-
120
-
121
-
122
-
123
-
124
-
125
-
126
-
127
-
128
-
129
-
130
-
131
-
132
-
133
-
134
-
135
-
136
-
137
-
138
-
139
-
140
-
141
-
142
-
143
-
144
-
145
-
146
-
147
-
148
-
149
-
150
-
151
-
152
-
153
-
154
 |
 |
89
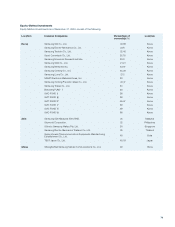
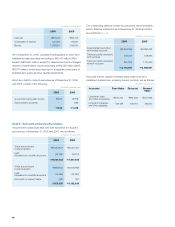
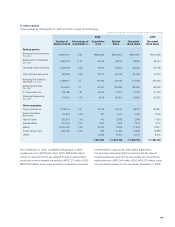
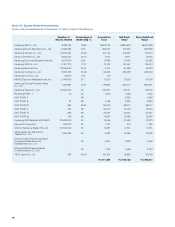
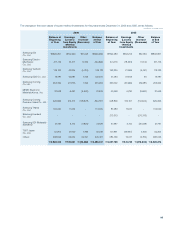
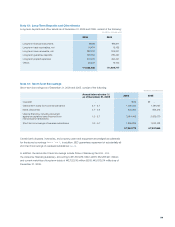
1) Listed equities
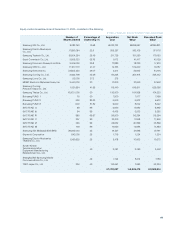
Listed equities as of December 31, 2006 and 2005, consist of the following:
2006 2005
Number of
Shares Owned
Percentage of
Ownership (%)
Acquisition
Cost
Market
Value
Recorded
Book Value
Recorded
Book Value
Related parties
Samsung Heavy Industries
Co., Ltd. 40,675,641 17.61 \258,299 \907,067 \907,067 \721,993
Samsung Fine Chemicals
Co., Ltd. 2,969,730 11.51 61,375 69,195 69,195 98,744
The Shilla Hotels & Resorts 2,529,580 6.35 18,604 38,323 38,323 32,758
Cheil Communications Inc. 259,949 5.65 25,737 60,048 60,048 57,319
Samsung Fire & Marine
Insurance Co., Ltd. 2,298,377 4.7 90,443 371,188 371,188 294,192
Samsung Securities
Co., Ltd. 3,143,194 4.7 57,347 159,360 159,360 195,192
S1 Corporation Inc. 725,060 1.91 16,207 31,431 31,431 31,758
Samsung Engineering
Co., Ltd. 704,104 1.76 9,018 30,452 30,452 20,067
Other companies
Cheil Industries Inc. 2,449,713 4.9 18,339 96,151 96,151 68,837
Korea Information
Service Inc. 107,603 2.26 797 2,513 2,513 2,109
Hanmi Capital 235,676 1.54 415 2,086 2,086 1,933
Saehan Media 973,738 2.32 1,840 1,675 1,675 2,118
SANYO 10,000,000 0.53 37,061 11,806 11,806 27,517
Tomen device Corp. 832,000 12.23 883 16,360 16,360 18,888
Others 5,596 13,101 13,101 8,315
\601,961 \1,810,756 \1,810,756 \1,581,740
(In millions of Korean won, except for the number of shares and percentage)
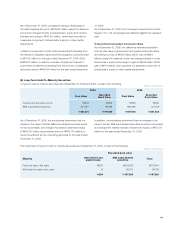
As of December 31, 2006, unrealized holding gains on listed
equities amount to \706,950 million (2005: \556,586 million),
except for deferred income tax charged directly to shareholders’
equity and minority interests amounting to \527,375 million (2005:
\432,490 million), which were recorded in a separate component
of shareholders’ equity under other capital adjustments.
The Company determined that the decline in the fair value of
certain investments would not be recoverable, and recorded an
impairment loss of \13,349 million (2005: \13,316 million) under
non-operating expenses for the year ended December 31, 2006.