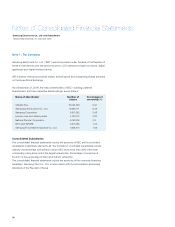
Samsung 2006 Annual Report Download - page 82
Download and view the complete annual report
Please find page 82 of the 2006 Samsung annual report below. You can navigate through the pages in the report by either clicking on the pages listed below, or by using the keyword search tool below to find specific information within the annual report.-
 1
1 -
2
-
3
-
4
-
5
-
6
-
7
-
8
-
9
-
10
-
11
-
12
-
13
-
14
-
15
-
16
-
17
-
18
-
19
-
20
-
21
-
22
-
23
-
24
-
25
-
26
-
27
-
28
-
29
-
30
-
31
-
32
-
33
-
34
-
35
-
36
-
37
-
38
-
39
-
40
-
41
-
42
-
43
-
44
-
45
-
46
-
47
-
48
-
49
-
50
-
51
-
52
-
53
-
54
-
55
-
56
-
57
-
58
-
59
-
60
-
61
-
62
-
63
-
64
-
65
-
66
-
67
-
68
-
69
-
70
-
71
-
 72
72 -
 73
73 -
 74
74 -
 75
75 -
 76
76 -
 77
77 -
 78
78 -
 79
79 -
 80
80 -
 81
81 -
 82
82 -
 83
83 -
 84
84 -
 85
85 -
 86
86 -
 87
87 -
 88
88 -
 89
89 -
 90
90 -
 91
91 -
 92
92 -
93
-
94
-
95
-
96
-
97
-
98
-
99
-
100
-
101
-
102
-
103
-
104
-
105
-
106
-
107
-
108
-
109
-
110
-
111
-
112
-
113
-
114
-
115
-
116
-
117
-
118
-
119
-
120
-
121
-
122
-
123
-
124
-
125
-
126
-
127
-
128
-
129
-
130
-
131
-
132
-
133
-
134
-
135
-
136
-
137
-
138
-
139
-
140
-
141
-
142
-
143
-
144
-
145
-
146
-
147
-
148
-
149
-
150
-
151
-
152
-
153
-
154
 |
 |
72
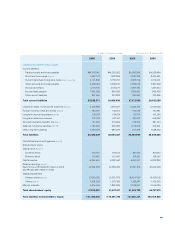
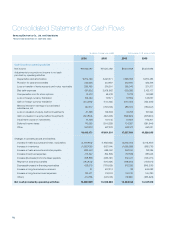
2006 2005 2006 2005
Cash flows from operating activities
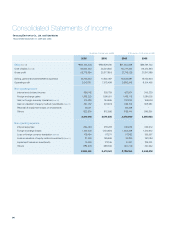
Net income \7,926,087 \7,640,092 $8,531,848 $8,223,996
Adjustments to reconcile net income to net cash
provided by operating activities
Depreciation and amortization 6,872,793 6,020,371 7,398,055 6,480,485
Provision for severance benefits 522,926 457,387 562,891 492,343
Loss on transfer of trade accounts and notes receivable 269,450 205,501 290,043 221,207
Bad debt expenses 281,826 2,008,662 303,365 2,162,177
Compensation cost for stock options 16,470 59,439 17,729 63,982
Loss on foreign currency translation 109,494 117,571 117,862 126,557
Gain on foreign currency translation (214,686) (144,465) (231,094) (155,506)
Minority interest in earnings of consolidated
subsidiaries, net 267,572 (733,025) 288,022 (789,047)
Loss on valuation of equity-method investments 31,396 149,656 33,795 161,094
Gain on valuation to equity-method investments (340,893) (491,405) (366,946) (528,961)
Impairment losses on investments 14,499 172,145 15,607 185,301
Deferred income taxes 115,565 (354,826) 124,397 (381,944)
Other 540,972 527,228 582,317 567,521
16,413,471 15,634,331 17,667,891 16,829,205
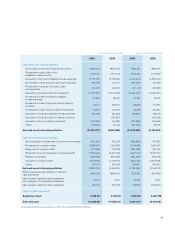
Changes in operating assets and liabilities
Increase in trade accounts and notes receivables (2,409,893) (1,966,662) (2,594,072) (2,116,967)
Increase in inventories (1,336,430) (637,044) (1,438,568) (685,731)
Increase in trade accounts and notes payable 882,643 696,002 950,100 749,195
Increase in accrued expenses 713,322 824,899 767,839 887,943
Increase (Decrease) in income taxes payable 308,838 (655,197) 332,441 (705,271)
Payment of severance benefits (184,845) (179,363) (198,972) (193,071)
Decrease(Increase) in financing receivables 628,275 (783,639) 676,292 (843,530)
Increase in long-term advance received 31 507,310 33 546,082
Increase in long-term accrued expenses 139,471 134,974 150,130 145,290
Others (74,284) (247,045) (79,961) (265,926)
Net cash provided by operating activities 15,080,599 13,328,566 16,233,153 14,347,219
(In millions of Korean won (note3)) (In thousands of U.S. dollars (note3))
Consolidated Statements of Cash Flows
Years Ended December 31, 2006 and 2005
Samsung Electronics Co., Ltd. and Subsidiaries