Samsung 2006 Annual Report Download - page 124
Download and view the complete annual report
Please find page 124 of the 2006 Samsung annual report below. You can navigate through the pages in the report by either clicking on the pages listed below, or by using the keyword search tool below to find specific information within the annual report.-
 1
1 -
2
-
3
-
4
-
5
-
6
-
7
-
8
-
9
-
10
-
11
-
12
-
13
-
14
-
15
-
16
-
17
-
18
-
19
-
20
-
21
-
22
-
23
-
24
-
25
-
26
-
27
-
28
-
29
-
30
-
31
-
32
-
33
-
34
-
35
-
36
-
37
-
38
-
39
-
40
-
41
-
42
-
43
-
44
-
45
-
46
-
47
-
48
-
49
-
50
-
51
-
52
-
53
-
54
-
55
-
56
-
57
-
58
-
59
-
60
-
61
-
62
-
63
-
64
-
65
-
66
-
67
-
68
-
69
-
70
-
71
-
72
-
73
-
74
-
75
-
76
-
77
-
78
-
79
-
80
-
81
-
82
-
83
-
84
-
85
-
86
-
87
-
88
-
89
-
90
-
91
-
92
-
93
-
94
-
95
-
96
-
97
-
98
-
99
-
100
-
101
-
102
-
103
-
104
-
105
-
106
-
107
-
108
-
109
-
110
-
111
-
112
-
113
-
 114
114 -
 115
115 -
 116
116 -
 117
117 -
 118
118 -
 119
119 -
 120
120 -
 121
121 -
 122
122 -
 123
123 -
 124
124 -
 125
125 -
 126
126 -
 127
127 -
 128
128 -
 129
129 -
 130
130 -
 131
131 -
 132
132 -
 133
133 -
 134
134 -
135
-
136
-
137
-
138
-
139
-
140
-
141
-
142
-
143
-
144
-
145
-
146
-
147
-
148
-
149
-
150
-
151
-
152
-
153
-
154
 |
 |

114
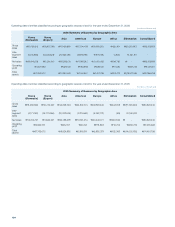
Basic earnings per share for the years ended December 31, 2006
and 2005, are calculated as follows:
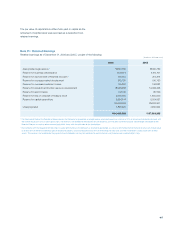
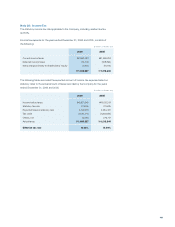
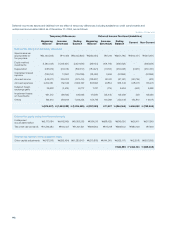
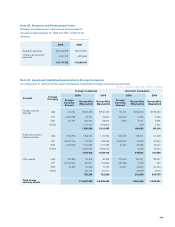
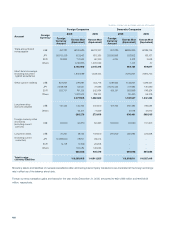
Temporary differences, which were not recognized to deferred tax
effect due to the uncertainty regarding ultimate ability to realize
such assets, as of December 31, 2006 and 2005, are as follows:
2006 2005
Gain on revaluation of land ¹\399,034 \411,691
Gain on valuation on equity-method
investments ²253,358 236,383
Undisposed accumulated deficit 2,457,237 2,558,846
Tax credit carryforwards 318,588 293,983
Others 136,034 106,593
¹ The Company does not expect cash inflows from the revalued land in the near future.
² The Company does not expect cash inflows, such as proceeds from the disposal of, or
receipts of dividends from, earnings arising from certain subsidiaries and equity method
investments within the foreseeable future.
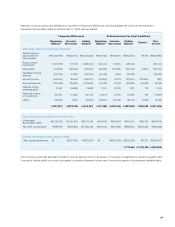
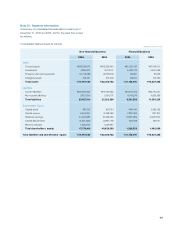
Deferred income tax assets and liabilities and income tax expense
charged directly to shareholders’ equity as of and for the years
ended December 31, 2006 and 2005, are as follows:
2006 2005
Ⅰ
. Deferred income tax assets
and liabilities
Gain(Loss) on valuation of
available-for-sale securities \(355,117) \(210,876)
Ⅱ
. Income tax expense
Gain on sale of treasury stock \(7,394) \(10,113)
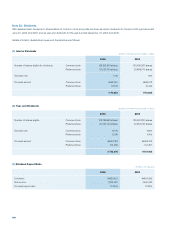
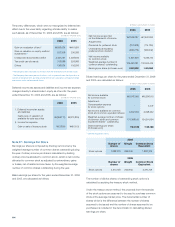
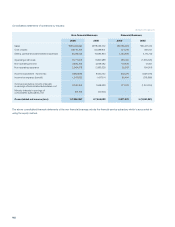
Note 27 : Earnings Per Share
Earnings per share is computed by dividing net income by the
weighted-average number of common shares outstanding during
the year. Ordinary income per share is calculated by dividing
ordinary income allocated to common stock, which is net income
allocated to common stock as adjusted by extraordinary gains
or losses, net of related income taxes, by the weighted-average
number of common shares outstanding during the year.
2006 2005
Net income as reported
on the statements of income \7,926,087 \7,640,092
Adjustments:
Dividends for preferred stock (112,408) (114,735)
Undeclared participating
preferred stock dividend (965,779) (929,242)
Net income available
for common stock 6,847,900 6,596,115
Weighted-average number of
common shares outstanding 129,499,781 132,003,416
Earnings per share (in Korean won) \52,880 \49,969
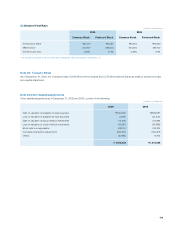
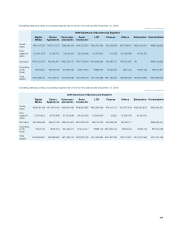
Diluted earnings per share for the years ended December 31, 2006
and 2005, are calculated as follows:
2006 2005
Net income available
for common stock \6,847,900 \6,596,115
Adjustment:
Compensation expense
for stock options - 2,437
Net income available for common
stock and common equivalent shares 6,847,900 6,598,552
Weighted-average number of shares
of common stock and common
equivalent shares ¹ outstanding
131,388,160 134,314,164
Diluted earnings per share
(in Korean won) \52,120 \49,128
1 Common equivalent shares:
2006
Number of
shares
Weight Common Stock
Equivalent
Stock options 1,888,379 365/365 1,888,379
2005
Number of
shares
Weight Common Stock
Equivalent
Stock options 2,310,748 365/365 2,310,748
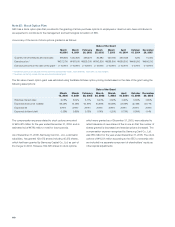
The number of dilutive shares of outstanding stock options is
calculated by applying the treasury stock method.
Under the treasury stock method, the proceeds from the exercise
of the stock options are assumed to be used to purchase common
stock at the average market price. The incremental number of
shares which is the difference between the number of shares
assumed to be issued and the number of shares assumed to be
purchased, is included in the denominator in calculating diluted
earnings per share.
(In millions of Korean won)
(In millions and number of shares)
(In millions of Korean won)
(In millions and number of shares)