Samsung 2006 Annual Report Download - page 144
Download and view the complete annual report
Please find page 144 of the 2006 Samsung annual report below. You can navigate through the pages in the report by either clicking on the pages listed below, or by using the keyword search tool below to find specific information within the annual report.-
 1
1 -
2
-
3
-
4
-
5
-
6
-
7
-
8
-
9
-
10
-
11
-
12
-
13
-
14
-
15
-
16
-
17
-
18
-
19
-
20
-
21
-
22
-
23
-
24
-
25
-
26
-
27
-
28
-
29
-
30
-
31
-
32
-
33
-
34
-
35
-
36
-
37
-
38
-
39
-
40
-
41
-
42
-
43
-
44
-
45
-
46
-
47
-
48
-
49
-
50
-
51
-
52
-
53
-
54
-
55
-
56
-
57
-
58
-
59
-
60
-
61
-
62
-
63
-
64
-
65
-
66
-
67
-
68
-
69
-
70
-
71
-
72
-
73
-
74
-
75
-
76
-
77
-
78
-
79
-
80
-
81
-
82
-
83
-
84
-
85
-
86
-
87
-
88
-
89
-
90
-
91
-
92
-
93
-
94
-
95
-
96
-
97
-
98
-
99
-
100
-
101
-
102
-
103
-
104
-
105
-
106
-
107
-
108
-
109
-
110
-
111
-
112
-
113
-
114
-
115
-
116
-
117
-
118
-
119
-
120
-
121
-
122
-
123
-
124
-
125
-
126
-
127
-
128
-
129
-
130
-
131
-
132
-
133
-
 134
134 -
 135
135 -
 136
136 -
 137
137 -
 138
138 -
 139
139 -
 140
140 -
 141
141 -
 142
142 -
 143
143 -
 144
144 -
 145
145 -
 146
146 -
 147
147 -
 148
148 -
 149
149 -
 150
150 -
 151
151 -
 152
152 -
 153
153 -
 154
154
 |
 |
134
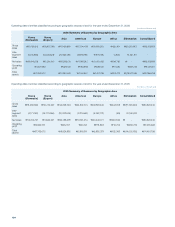
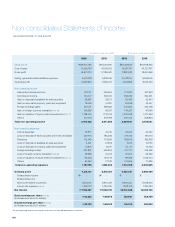
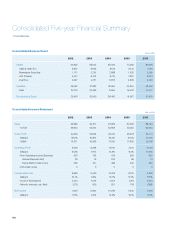
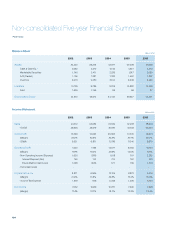
Non-consolidated Five-year Financial Summary
Parent base
(Billion KRW)
Balance Sheet
2002 2003 2004 2005 2006
Assets 34,440 39,203 43,817 50,539 57,809
Cash & Cash Eq. *5,682 5,515 5,145 4,951 4,313
Marketable Securities 1,745 2,471 2,289 1,917 2,059
A/R (Traded) 1,105 1,381 1,332 1,497 1,842
Inventory 2,273 2,480 3,154 2,909 3,220
Liabilities 10,129 9,789 9,376 10,882 12,549
Debt 1,626 1,159 99 96 87
Stockholder’s Equity 24,310 29,414 34,440 39,657 45,261
(Billion KRW)
Income Statement
2002 2003 2004 2005 2006
Sales 40,512 43,582 57,632 57,458 58,973
- COGS 26,946 29,519 37,280 40,158 42,360
Gross Profit 13,566 14,063 20,353 17,300 16,613
(Margin) 33.5% 32.3% 35.3% 30.1% 28.2%
- SG&A 6,321 6,871 8,336 9,240 9,679
Operating Profit 7,245 7,193 12,017 8,060 6,934
(Margin) 17.9% 16.5% 20.9% 14.0% 11.8%
- Non Operating Income (Expense) 1,626 (288) 1,108 811 2,282
Interest Payment (Net) 145 143 214 167 190
Equity Method Gain (Loss) 1,068 (229) 577 159 1,706
- Extra Gain (Loss) - - - - -
Income before tax 8,871 6,905 13,125 8,870 9,216
(Margin) 21.9% 15.8% 22.8% 15.4% 15.6%
- Income Tax Expense 1,819 946 2,338 1,230 1,290
Net Income 7,052 5,959 10,787 7,640 7,926
(Margin) 17.4% 13.7% 18.7% 13.3% 13.4%