Samsung 2006 Annual Report Download - page 141
Download and view the complete annual report
Please find page 141 of the 2006 Samsung annual report below. You can navigate through the pages in the report by either clicking on the pages listed below, or by using the keyword search tool below to find specific information within the annual report.-
 1
1 -
2
-
3
-
4
-
5
-
6
-
7
-
8
-
9
-
10
-
11
-
12
-
13
-
14
-
15
-
16
-
17
-
18
-
19
-
20
-
21
-
22
-
23
-
24
-
25
-
26
-
27
-
28
-
29
-
30
-
31
-
32
-
33
-
34
-
35
-
36
-
37
-
38
-
39
-
40
-
41
-
42
-
43
-
44
-
45
-
46
-
47
-
48
-
49
-
50
-
51
-
52
-
53
-
54
-
55
-
56
-
57
-
58
-
59
-
60
-
61
-
62
-
63
-
64
-
65
-
66
-
67
-
68
-
69
-
70
-
71
-
72
-
73
-
74
-
75
-
76
-
77
-
78
-
79
-
80
-
81
-
82
-
83
-
84
-
85
-
86
-
87
-
88
-
89
-
90
-
91
-
92
-
93
-
94
-
95
-
96
-
97
-
98
-
99
-
100
-
101
-
102
-
103
-
104
-
105
-
106
-
107
-
108
-
109
-
110
-
111
-
112
-
113
-
114
-
115
-
116
-
117
-
118
-
119
-
120
-
121
-
122
-
123
-
124
-
125
-
126
-
127
-
128
-
129
-
130
-
 131
131 -
 132
132 -
 133
133 -
 134
134 -
 135
135 -
 136
136 -
 137
137 -
 138
138 -
 139
139 -
 140
140 -
 141
141 -
 142
142 -
 143
143 -
 144
144 -
 145
145 -
 146
146 -
 147
147 -
 148
148 -
 149
149 -
 150
150 -
 151
151 -
152
-
153
-
154
 |
 |
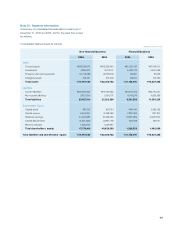
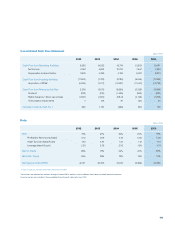
131
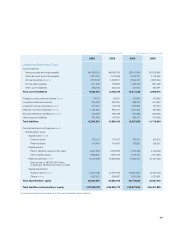
2006 2005 2006 2005
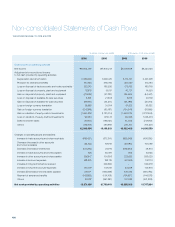
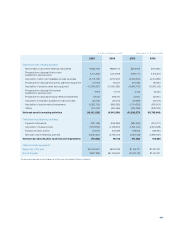
Cash flows from investing activities
Net increase in short-term financial instruments \562,790 \288,775 $605,802 $310,845
Proceeds from disposal of short-term
available-for-sale securities 3,704,638 3,574,058 3,987,770 3,847,210
Acquisition of short-term available-for-sale securities (3,718,158) (3,172,410) (4,002,323) (3,414,865)
Proceeds from disposal of property, plant and equipment 311,183 174,321 334,966 187,644
Acquisition of property, plant and equipment (10,078,237) (10,080,695) (10,848,479) (10,851,125)
Proceeds from disposal of long-term
available-for-sale securities 3,183 21,574 3,426 23,223
Proceeds from disposal of equity-method investments 23,139 396,510 24,907 426,814
Acquisition of long-term available-for-sale securities (18,539) (30,074) (19,956) (32,372)
Acquisition of equity-method investments (1,053,753) (866,665) (1,134,287) (932,901)
Others (217,475) (250,658) (234,096) (269,816)
Net cash used in investing activities (10,481,229) (9,945,264) (11,282,270) (10,705,343)
Cash flows from financing activities
Payment of dividends (831,789) (849,363) (895,360) (914,277)
Acquisition of treasury stock (1,812,880) (2,149,370) (1,951,432) (2,313,638)
Exercise of stock options 176,179 249,329 189,644 268,384
Net cash used in financing activities (2,468,490) (2,749,404) (2,657,148) (2,959,531)
Net increase (decrease) in cash and cash equivalents (75,563) 95,733 (81,338) 103,050
Cash and cash equivalents
Beginning of the year \1,053,552 \957,819 $1,134,071 $1,031,021
End of the year \977,989 \1,053,552 $1,052,733 $1,134,071
The accompanying notes are an integral part of these non-consolidated financial statements.
(In millions of Korean won (note3)) (In thousands of U.S. dollars (note3))