Samsung 2006 Annual Report Download - page 145
Download and view the complete annual report
Please find page 145 of the 2006 Samsung annual report below. You can navigate through the pages in the report by either clicking on the pages listed below, or by using the keyword search tool below to find specific information within the annual report.-
 1
1 -
2
-
3
-
4
-
5
-
6
-
7
-
8
-
9
-
10
-
11
-
12
-
13
-
14
-
15
-
16
-
17
-
18
-
19
-
20
-
21
-
22
-
23
-
24
-
25
-
26
-
27
-
28
-
29
-
30
-
31
-
32
-
33
-
34
-
35
-
36
-
37
-
38
-
39
-
40
-
41
-
42
-
43
-
44
-
45
-
46
-
47
-
48
-
49
-
50
-
51
-
52
-
53
-
54
-
55
-
56
-
57
-
58
-
59
-
60
-
61
-
62
-
63
-
64
-
65
-
66
-
67
-
68
-
69
-
70
-
71
-
72
-
73
-
74
-
75
-
76
-
77
-
78
-
79
-
80
-
81
-
82
-
83
-
84
-
85
-
86
-
87
-
88
-
89
-
90
-
91
-
92
-
93
-
94
-
95
-
96
-
97
-
98
-
99
-
100
-
101
-
102
-
103
-
104
-
105
-
106
-
107
-
108
-
109
-
110
-
111
-
112
-
113
-
114
-
115
-
116
-
117
-
118
-
119
-
120
-
121
-
122
-
123
-
124
-
125
-
126
-
127
-
128
-
129
-
130
-
131
-
132
-
133
-
134
-
 135
135 -
 136
136 -
 137
137 -
 138
138 -
 139
139 -
 140
140 -
 141
141 -
 142
142 -
 143
143 -
 144
144 -
 145
145 -
 146
146 -
 147
147 -
 148
148 -
 149
149 -
 150
150 -
 151
151 -
 152
152 -
 153
153 -
 154
154
 |
 |
135
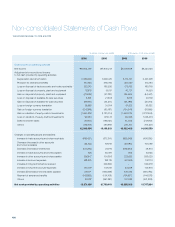
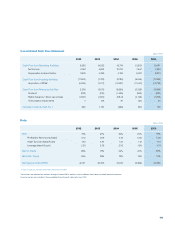
Cash Flow Statement
2002 2003 2004 2005 2006
Cash Flow from Operating Activities 11,193 9,848 14,804 12,790 12,874
Net Income 7,052 5,959 10,787 7,640 7,926
Depreciation & Armortization 3,156 3,761 4,526 5,060 5,681
Cash Flow from Investing Activities (8,462) (7,644) (8,792) (9,945) (10,481)
Acquisition of PP&E (4,322) (6,789) (7,870) (10,081) (9,767)
Cash Flow from Financing Activities (2,312) (2,345) (6,323) (2,749) (2,469)
Dividend (913) (887) (1,564) (834) (821)
Rights Issuance / Stock repurchase (1,500) (1,979) (3,841) (2,149) (1,813)
Increase in Cash & Cash Eq. *419 (141) (310) 96 (76)
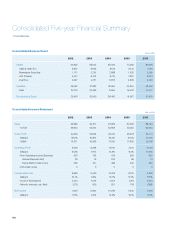
Financial Ratios
2002 2003 2004 2005 2006
ROE 32% 22% 34% 21% 19%
Profitability (Net Income/Sales) 0.17 0.14 0.19 0.13 0.13
Asset Turnover (Sales/Asset) 1.30 1.18 1.39 1.22 1.09
Leverage (Asset/Equity) 1.42 1.37 1.30 1.27 1.28
Debt / Equity 7% 4% 0% 0% 0%
Net Debt / Equity -24% -23% -21% -17% -14%
Earnings per share (KRW) 42,005 36,356 67,899 49,970 52,880
* Cash & Cash Eq. includes short-term financial instruments
The numbers are adjusted for the latest change in Korean GAAP and thus may be different from those stated in audited financial statements
(Billion KRW)
(Billion KRW)