Samsung 2006 Annual Report Download - page 76
Download and view the complete annual report
Please find page 76 of the 2006 Samsung annual report below. You can navigate through the pages in the report by either clicking on the pages listed below, or by using the keyword search tool below to find specific information within the annual report.-
 1
1 -
2
-
3
-
4
-
5
-
6
-
7
-
8
-
9
-
10
-
11
-
12
-
13
-
14
-
15
-
16
-
17
-
18
-
19
-
20
-
21
-
22
-
23
-
24
-
25
-
26
-
27
-
28
-
29
-
30
-
31
-
32
-
33
-
34
-
35
-
36
-
37
-
38
-
39
-
40
-
41
-
42
-
43
-
44
-
45
-
46
-
47
-
48
-
49
-
50
-
51
-
52
-
53
-
54
-
55
-
56
-
57
-
58
-
59
-
60
-
61
-
62
-
63
-
64
-
65
-
 66
66 -
 67
67 -
 68
68 -
 69
69 -
 70
70 -
 71
71 -
 72
72 -
 73
73 -
 74
74 -
 75
75 -
 76
76 -
 77
77 -
 78
78 -
 79
79 -
 80
80 -
 81
81 -
 82
82 -
 83
83 -
 84
84 -
 85
85 -
 86
86 -
87
-
88
-
89
-
90
-
91
-
92
-
93
-
94
-
95
-
96
-
97
-
98
-
99
-
100
-
101
-
102
-
103
-
104
-
105
-
106
-
107
-
108
-
109
-
110
-
111
-
112
-
113
-
114
-
115
-
116
-
117
-
118
-
119
-
120
-
121
-
122
-
123
-
124
-
125
-
126
-
127
-
128
-
129
-
130
-
131
-
132
-
133
-
134
-
135
-
136
-
137
-
138
-
139
-
140
-
141
-
142
-
143
-
144
-
145
-
146
-
147
-
148
-
149
-
150
-
151
-
152
-
153
-
154
 |
 |
66
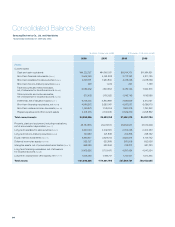
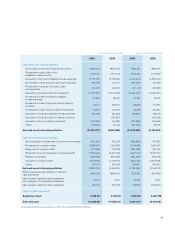
2006 2005 2006 2005
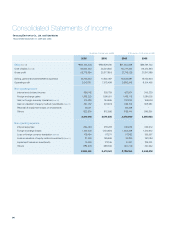
Sales (Note 28) \85,425,626 \80,629,510 $91,954,388 $86,791,722
Cost of sales (Note 28) 59,652,262 55,251,655 64,211,262 59,474,333
Gross profit 25,773,364 25,377,855 27,743,126 27,317,389
Selling, general and administrative expenses 16,765,553 17,802,357 18,046,881 19,162,924
Operating profit 9,007,811 7,575,498 9,696,245 8,154,465
Non-operating income
Interest and dividend income 396,742 320,709 427,064 345,220
Foreign exchange gains 1,333,220 1,190,611 1,435,113 1,281,605
Gain on foreign currency translation (Note 30) 214,686 144,465 231,094 155,506
Gain on valuation of equity method investments (Note 10) 551,057 491,405 593,172 528,961
Reversal of impairment losses on investments 92,211 - 99,258 -
Others 822,300 872,666 885,144 939,361
3,410,216 3,019,856 3,670,845 3,250,653
Non-operating expenses
Interest expenses 294,449 218,233 316,953 234,912
Foreign exchange losses 1,257,270 1,124,380 1,353,358 1,210,312
Loss on foreign currency translation (Note 30) 109,494 117,571 117,862 126,557
Loss on valuation of equity method investments (Note 10) 31,396 149,656 33,795 161,094
Impairment losses on investments 14,499 172,145 15,607 185,301
Others 883,273 688,056 950,779 740,642
2,590,381 2,470,041 2,788,354 2,658,818
Consolidated Statements of Income
(In millions of Korean won (note3)) (In thousands of U.S. dollars (note3))
Years Ended December 31, 2006 and 2005
Samsung Electronics Co., Ltd. and Subsidiaries