Samsung 2006 Annual Report Download - page 131
Download and view the complete annual report
Please find page 131 of the 2006 Samsung annual report below. You can navigate through the pages in the report by either clicking on the pages listed below, or by using the keyword search tool below to find specific information within the annual report.-
 1
1 -
2
-
3
-
4
-
5
-
6
-
7
-
8
-
9
-
10
-
11
-
12
-
13
-
14
-
15
-
16
-
17
-
18
-
19
-
20
-
21
-
22
-
23
-
24
-
25
-
26
-
27
-
28
-
29
-
30
-
31
-
32
-
33
-
34
-
35
-
36
-
37
-
38
-
39
-
40
-
41
-
42
-
43
-
44
-
45
-
46
-
47
-
48
-
49
-
50
-
51
-
52
-
53
-
54
-
55
-
56
-
57
-
58
-
59
-
60
-
61
-
62
-
63
-
64
-
65
-
66
-
67
-
68
-
69
-
70
-
71
-
72
-
73
-
74
-
75
-
76
-
77
-
78
-
79
-
80
-
81
-
82
-
83
-
84
-
85
-
86
-
87
-
88
-
89
-
90
-
91
-
92
-
93
-
94
-
95
-
96
-
97
-
98
-
99
-
100
-
101
-
102
-
103
-
104
-
105
-
106
-
107
-
108
-
109
-
110
-
111
-
112
-
113
-
114
-
115
-
116
-
117
-
118
-
119
-
120
-
 121
121 -
 122
122 -
 123
123 -
 124
124 -
 125
125 -
 126
126 -
 127
127 -
 128
128 -
 129
129 -
 130
130 -
 131
131 -
 132
132 -
 133
133 -
 134
134 -
 135
135 -
 136
136 -
 137
137 -
 138
138 -
 139
139 -
 140
140 -
 141
141 -
142
-
143
-
144
-
145
-
146
-
147
-
148
-
149
-
150
-
151
-
152
-
153
-
154
 |
 |
121
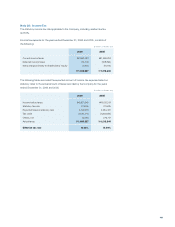
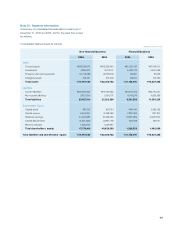
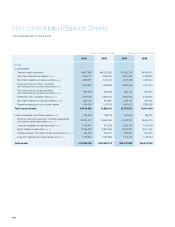
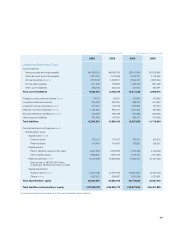
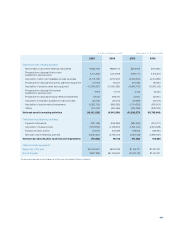
Non-financial Business Financial Business
2006 2005 2006 2005
Assets
Current assets \29,619,547 \26,365,240 \5,367,432 \7,033,011
Investments 7,086,603 6,179,747 5,632,774 5,591,086
Property, plant and equipment 33,719,089 29,189,119 65,691 87,048
Intangible assets 572,191 516,676 86,194 116,180
Total assets \70,997,430 \62,250,782 \11,152,091 \12,827,325
Liabilities
Current liabilities \20,603,624 \18,167,652 \4,917,322 \6,740,037
Non-current liabilities 3,323,390 3,154,737 4,414,216 4,625,199
Total liabilities 23,927,014 21,322,389 9,331,538 11,365,236
Shareholders’ Equity
Capital stock 897,514 897,514 496,444 2,482,189
Capital surplus 6,364,604 6,338,460 2,881,055 921,914
Retained earnings 44,463,683 37,369,265 (1,963,285) (2,235,155)
Capital adjustments (6,461,390) (4,897,713) 406,339 293,141
Minority interests 1,806,005 1,220,867 - -
Total shareholders’ equity 47,070,416 40,928,393 1,820,553 1,462,089
Total liabilities and shareholders’ equity \70,997,430 \62,250,782 \11,152,091 \12,827,325
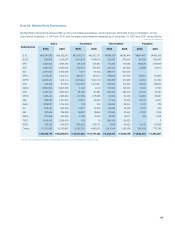
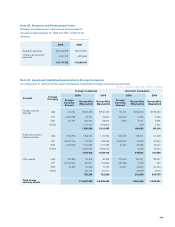
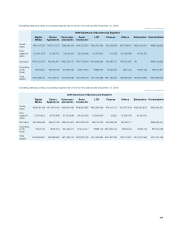
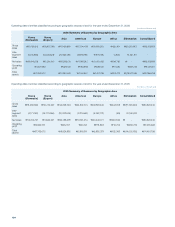
Note 31 : Segment Information
A summary of consolidated financial data by industry as of
December 31, 2006 and 2005, and for the years then ended,
are follows:
Consolidated balance sheets by industry
(In millions of Korean won)