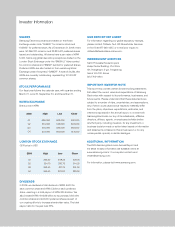
Samsung 2006 Annual Report Download - page 138
Download and view the complete annual report
Please find page 138 of the 2006 Samsung annual report below. You can navigate through the pages in the report by either clicking on the pages listed below, or by using the keyword search tool below to find specific information within the annual report.-
 1
1 -
2
-
3
-
4
-
5
-
6
-
7
-
8
-
9
-
10
-
11
-
12
-
13
-
14
-
15
-
16
-
17
-
18
-
19
-
20
-
21
-
22
-
23
-
24
-
25
-
26
-
27
-
28
-
29
-
30
-
31
-
32
-
33
-
34
-
35
-
36
-
37
-
38
-
39
-
40
-
41
-
42
-
43
-
44
-
45
-
46
-
47
-
48
-
49
-
50
-
51
-
52
-
53
-
54
-
55
-
56
-
57
-
58
-
59
-
60
-
61
-
62
-
63
-
64
-
65
-
66
-
67
-
68
-
69
-
70
-
71
-
72
-
73
-
74
-
75
-
76
-
77
-
78
-
79
-
80
-
81
-
82
-
83
-
84
-
85
-
86
-
87
-
88
-
89
-
90
-
91
-
92
-
93
-
94
-
95
-
96
-
97
-
98
-
99
-
100
-
101
-
102
-
103
-
104
-
105
-
106
-
107
-
108
-
109
-
110
-
111
-
112
-
113
-
114
-
115
-
116
-
117
-
118
-
119
-
120
-
121
-
122
-
123
-
124
-
125
-
126
-
127
-
 128
128 -
 129
129 -
 130
130 -
 131
131 -
 132
132 -
 133
133 -
 134
134 -
 135
135 -
 136
136 -
 137
137 -
 138
138 -
 139
139 -
 140
140 -
 141
141 -
 142
142 -
 143
143 -
 144
144 -
 145
145 -
 146
146 -
 147
147 -
 148
148 -
149
-
150
-
151
-
152
-
153
-
154
 |
 |
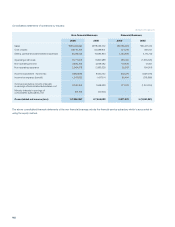
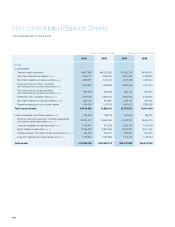
128
2006 2005 2006 2005
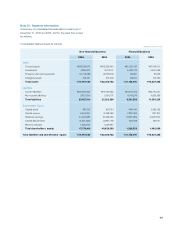
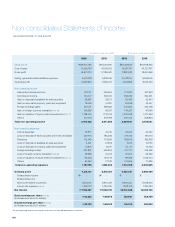
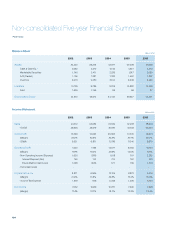
Sales (Note 26) \58,972,765 \57,457,670 $63,479,833 $61,848,945
Cost of sales 42,359,753 40,158,150 45,597,151 43,227,287
Gross profit 16,613,012 17,299,520 17,882,682 18,621,658
Selling, general and administrative expenses 9,679,079 9,239,745 10,418,814 9,945,905
Operating profit 6,933,933 8,059,775 7,463,868 8,675,753
Non-operating income
Interest and dividend income 257,417 229,654 277,090 247,206
Commission income 315,172 366,519 339,259 394,531
Gain on disposal of available-for-sale securities 58,980 33,271 63,488 35,814
Gain on disposal of property, plant and equipment 78,636 41,291 84,646 44,447
Foreign exchange gains 403,701 399,624 434,554 430,166
Gain on foreign currency translation (Note 28) 124,998 90,187 134,551 97,080
Gain on valuation of equity-method investments (Note 10) 1,798,505 1,131,014 1,935,958 1,217,453
Others 372,013 379,799 400,445 408,824
Total non-operating income 3,409,422 2,671,359 3,669,991 2,875,521
Non-operating expenses
Interest expenses 48,877 42,214 52,612 45,440
Loss on disposal of trade accounts and notes receivable 253,740 185,536 273,132 199,716
Donations 175,249 173,563 188,643 186,828
Loss on disposal of available-for-sale securities 3,691 21,533 3,973 23,179
Loss on disposal of property, plant and equipment 37,876 13,517 40,771 14,550
Foreign exchange losses 391,831 348,804 421,777 375,462
Loss on foreign currency translation (Note 28) 28,988 31,244 31,203 33,632
Loss on valuation of equity-method investments (Note 10) 92,553 972,173 99,626 1,046,473
Others 94,353 72,078 101,565 77,585
Total non-operating expenses 1,127,158 1,860,662 1,213,302 2,002,865
Ordinary profit 9,216,197 8,870,472 9,920,557 9,548,409
Extraordinary income \ - \ - $ - $ -
Extraordinary loss - - - -
Net income before income tax 9,216,197 8,870,472 9,920,557 9,548,409
Income tax expense (Note 24) 1,290,110 1,230,259 1,388,709 1,324,283
Net income \7,926,087 \7,640,213 $8,531,848 $8,224,126
Basic earnings per share (Note 25)
(in Korean won and U.S. dollars) \52,880 \49,970 $56,921 $53,789
Diluted earnings per share (Note 25)
(in Korean won and U.S. dollars) \52,120 \49,128 $56,103 $52,883
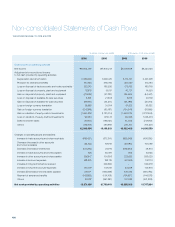
Non-consolidated Statements of Income
Years Ended December 31, 2006 and 2005
The accompanying notes are an integral part of these non-consolidated financial statements.
(In millions of Korean won (note3)) (In thousands of U.S. dollars (note3))