Samsung 2006 Annual Report Download - page 133
Download and view the complete annual report
Please find page 133 of the 2006 Samsung annual report below. You can navigate through the pages in the report by either clicking on the pages listed below, or by using the keyword search tool below to find specific information within the annual report.-
 1
1 -
2
-
3
-
4
-
5
-
6
-
7
-
8
-
9
-
10
-
11
-
12
-
13
-
14
-
15
-
16
-
17
-
18
-
19
-
20
-
21
-
22
-
23
-
24
-
25
-
26
-
27
-
28
-
29
-
30
-
31
-
32
-
33
-
34
-
35
-
36
-
37
-
38
-
39
-
40
-
41
-
42
-
43
-
44
-
45
-
46
-
47
-
48
-
49
-
50
-
51
-
52
-
53
-
54
-
55
-
56
-
57
-
58
-
59
-
60
-
61
-
62
-
63
-
64
-
65
-
66
-
67
-
68
-
69
-
70
-
71
-
72
-
73
-
74
-
75
-
76
-
77
-
78
-
79
-
80
-
81
-
82
-
83
-
84
-
85
-
86
-
87
-
88
-
89
-
90
-
91
-
92
-
93
-
94
-
95
-
96
-
97
-
98
-
99
-
100
-
101
-
102
-
103
-
104
-
105
-
106
-
107
-
108
-
109
-
110
-
111
-
112
-
113
-
114
-
115
-
116
-
117
-
118
-
119
-
120
-
121
-
122
-
 123
123 -
 124
124 -
 125
125 -
 126
126 -
 127
127 -
 128
128 -
 129
129 -
 130
130 -
 131
131 -
 132
132 -
 133
133 -
 134
134 -
 135
135 -
 136
136 -
 137
137 -
 138
138 -
 139
139 -
 140
140 -
 141
141 -
 142
142 -
 143
143 -
144
-
145
-
146
-
147
-
148
-
149
-
150
-
151
-
152
-
153
-
154
 |
 |

123
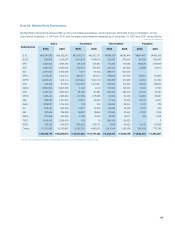
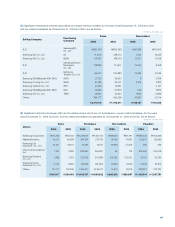
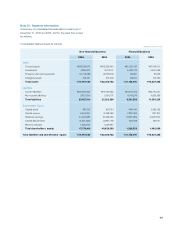
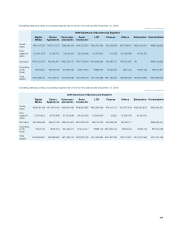
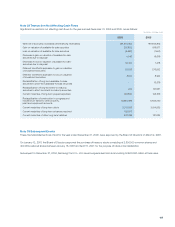
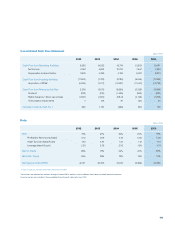
Operating data according to business segment as of and for the year ended December 31, 2006:
2006 Summary of Business by Segment
Digital
Media
Device
Appliances
Telecomm-
unications
Semi-
Conductor
LCD Finance Others Elimination Consolidated
Gross
sales \44,717,513 \10,271,757 \36,361,108 \40,757,627 \25,427,332 \2,195,979 \17,246,127 \(91,551,817) \85,425,626
Inter-
segment
sales
(23,991,979) (4,738,417) (16,115,381) (20,049,199) (14,487,967) (14,278) (12,154,596) 91,551,817 -
Net sales \20,725,534 \5,533,340 \20,245,727 \20,708,428 \10,939,365 \2,181,701 \5,091,531 \ - \85,425,626
Operating
profit
(loss)
\579,321 \(106,406) \1,980,354 \5,151,902 \839,106 \230,331 \(4,020) \337,223 \9,007,811
Total
assets \14,058,014 \3,789,101 \12,906,452 \31,083,615 \17,064,598 \11,152,091 \9,319,498 \(18,007,163) \81,366,206
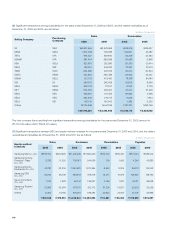
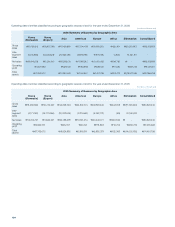
Operating data according to business segment as of and for the year ended December 31, 2005:
2005 Summary of Business by Segment
Digital
Media
Device
Appliances
Telecomm-
unications
Semi-
Conductor
LCD Finance Others Elimination Consolidated
Gross
sales \35,031,168 \10,594,106 \36,641,463 \38,582,867 \20,564,098 \2,401,072 \17,975,256 \(81,160,520) \80,629,510
Inter-
segment
sales
(17,374,610) (4,976,398) (15,726,648) (18,250,632) (11,848,873) (5,280) 12,978,079) 81,160,520 -
Net sales \17,656,558 \5,617,708 \20,914,815 \20,332,235 \8,715,225 \2,395,792 \4,997,177 - \80,629,510
Operating
profit
(loss)
\247,700 \(29,102) \2,480,001 \5,410,677 \598,773 \(1,376,720) \(36,540) \280,709 \7,575,498
Total
assets \10,848,994 \3,658,525 \11,965,742 \26,326,732 \14,135,584 \12,827,325 \8,701,091 \(14,002,195) \74,461,798
(In millions of Korean won)
(In millions of Korean won)