Samsung 2006 Annual Report Download - page 142
Download and view the complete annual report
Please find page 142 of the 2006 Samsung annual report below. You can navigate through the pages in the report by either clicking on the pages listed below, or by using the keyword search tool below to find specific information within the annual report.-
 1
1 -
2
-
3
-
4
-
5
-
6
-
7
-
8
-
9
-
10
-
11
-
12
-
13
-
14
-
15
-
16
-
17
-
18
-
19
-
20
-
21
-
22
-
23
-
24
-
25
-
26
-
27
-
28
-
29
-
30
-
31
-
32
-
33
-
34
-
35
-
36
-
37
-
38
-
39
-
40
-
41
-
42
-
43
-
44
-
45
-
46
-
47
-
48
-
49
-
50
-
51
-
52
-
53
-
54
-
55
-
56
-
57
-
58
-
59
-
60
-
61
-
62
-
63
-
64
-
65
-
66
-
67
-
68
-
69
-
70
-
71
-
72
-
73
-
74
-
75
-
76
-
77
-
78
-
79
-
80
-
81
-
82
-
83
-
84
-
85
-
86
-
87
-
88
-
89
-
90
-
91
-
92
-
93
-
94
-
95
-
96
-
97
-
98
-
99
-
100
-
101
-
102
-
103
-
104
-
105
-
106
-
107
-
108
-
109
-
110
-
111
-
112
-
113
-
114
-
115
-
116
-
117
-
118
-
119
-
120
-
121
-
122
-
123
-
124
-
125
-
126
-
127
-
128
-
129
-
130
-
131
-
 132
132 -
 133
133 -
 134
134 -
 135
135 -
 136
136 -
 137
137 -
 138
138 -
 139
139 -
 140
140 -
 141
141 -
 142
142 -
 143
143 -
 144
144 -
 145
145 -
 146
146 -
 147
147 -
 148
148 -
 149
149 -
 150
150 -
 151
151 -
 152
152 -
153
-
154
 |
 |
132
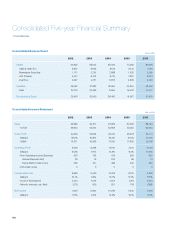
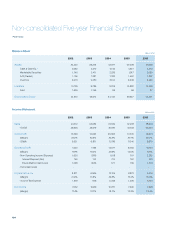
Consolidated Five-year Financial Summary
(Billion KRW)
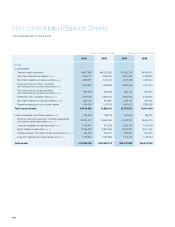
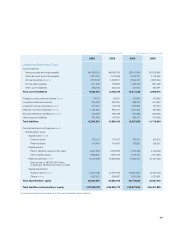
Consolidated Balance Sheet
2002 2003 2004 2005 2006
Assets 64,955 68,042 69,005 74,462 81,366
Cash & Cash Eq. *6,872 9,095 8,108 8,144 7,726
Marketable Securities 1,771 2,795 2,868 1,932 2,059
A/R (Traded) 5,427 6,315 6,774 7,397 9,090
Inventory 4,297 4,781 5,804 5,865 6,753
Liabilities 39,462 37,882 32,604 32,854 33,426
Debt 25,123 23,466 17,654 16,432 14,477
Stockholder’s Equity 25,493 30,160 36,400 41,607 47,940
(Billion KRW)
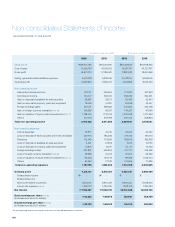
Consolidated Income Statement
2002 2003 2004 2005 2006
Sales 59,569 64,817 81,963 80,630 85,426
- COGS 36,952 42,252 52,953 55,252 59,652
Gross Profit 22,616 22,565 29,010 25,378 25,773
(Margin) 38.0% 34.8% 35.4% 31.5% 30.2%
- SG&A 13,371 16,269 17,250 17,802 16,766
Operating Profit 9,246 6,296 11,761 7,575 9,008
(Margin) 15.5% 9.7% 14.3% 9.4% 10.5%
- Non Operating Income (Expense) 323 133 615 550 820
Interest Payment (Net) 39 76 192 66 70
Equity Method Gain (Loss) 339 247 496 342 520
- Extra Gain (Loss) 0 0 0 0 0
Income before tax 9,569 6,430 12,376 8,125 9,828
(Margin) 16.1% 9.9% 15.1% 10.1% 11.5%
- Income Tax Expense 2,244 1,076 2,207 1,218 1,634
- Minority Interests, etc. (Net) (272) 609 621 733 (268)
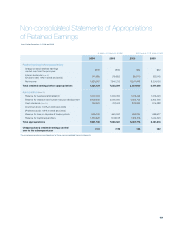
Net Income 7,053 5,962 10,790 7,640 7,926
(Margin) 11.8% 9.2% 13.2% 9.5% 9.3%
Consolidated base