Samsung 2006 Annual Report Download - page 119
Download and view the complete annual report
Please find page 119 of the 2006 Samsung annual report below. You can navigate through the pages in the report by either clicking on the pages listed below, or by using the keyword search tool below to find specific information within the annual report.-
 1
1 -
2
-
3
-
4
-
5
-
6
-
7
-
8
-
9
-
10
-
11
-
12
-
13
-
14
-
15
-
16
-
17
-
18
-
19
-
20
-
21
-
22
-
23
-
24
-
25
-
26
-
27
-
28
-
29
-
30
-
31
-
32
-
33
-
34
-
35
-
36
-
37
-
38
-
39
-
40
-
41
-
42
-
43
-
44
-
45
-
46
-
47
-
48
-
49
-
50
-
51
-
52
-
53
-
54
-
55
-
56
-
57
-
58
-
59
-
60
-
61
-
62
-
63
-
64
-
65
-
66
-
67
-
68
-
69
-
70
-
71
-
72
-
73
-
74
-
75
-
76
-
77
-
78
-
79
-
80
-
81
-
82
-
83
-
84
-
85
-
86
-
87
-
88
-
89
-
90
-
91
-
92
-
93
-
94
-
95
-
96
-
97
-
98
-
99
-
100
-
101
-
102
-
103
-
104
-
105
-
106
-
107
-
108
-
 109
109 -
 110
110 -
 111
111 -
 112
112 -
 113
113 -
 114
114 -
 115
115 -
 116
116 -
 117
117 -
 118
118 -
 119
119 -
 120
120 -
 121
121 -
 122
122 -
 123
123 -
 124
124 -
 125
125 -
 126
126 -
 127
127 -
 128
128 -
 129
129 -
130
-
131
-
132
-
133
-
134
-
135
-
136
-
137
-
138
-
139
-
140
-
141
-
142
-
143
-
144
-
145
-
146
-
147
-
148
-
149
-
150
-
151
-
152
-
153
-
154
 |
 |
109
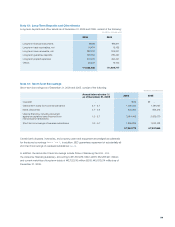
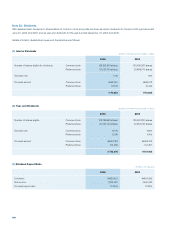
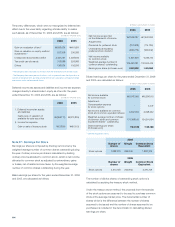
(D) Dividend Yield Ratio
2006 2005
Common Stock Preferred Stock Common Stock Preferred Stock
Dividend per share \5,500 \5,550 \5,500 \5,550
Market price ¹611,400 486,000 644,600 486,100
Dividend yield ratio 0.90% 1.14% 0.85% 1.14%
¹ The average closing price for the prior week from 2 trading days before closing date of shareholders’ list.
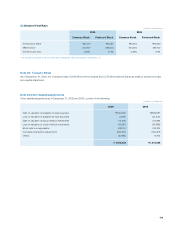
Note 23 : Treasury Stock
As of December 31, 2006, the Company holds 18,540,684 common shares and 2,579,693 preferred shares as treasury stocks recorded
as a capital adjustment.
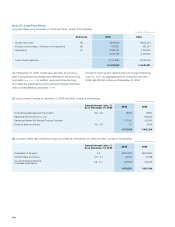
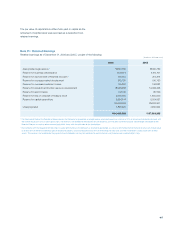
Note 24 Other Capital Adjustments
Other capital adjustments as of December 31, 2006 and 2005, consist of the following:
2006 2005
Gain on valuation of available-for-sale securities \733,050 \559,881
Loss on valuation of available-for-sale securities (1,933) (23,540)
Gain on valuation of equity-method investments 141,958 123,384
Loss on valuation of equity-method investments (43,887) (63,969)
Stock option compensation 539,152 616,824
Cumulative translation adjustments (293,812) (149,618)
Others (15,895) 10,103
\1,058,633 \1,073,065
(In millions of Korean won)
(In millions of Korean won)