Samsung 2006 Annual Report Download - page 126
Download and view the complete annual report
Please find page 126 of the 2006 Samsung annual report below. You can navigate through the pages in the report by either clicking on the pages listed below, or by using the keyword search tool below to find specific information within the annual report.-
 1
1 -
2
-
3
-
4
-
5
-
6
-
7
-
8
-
9
-
10
-
11
-
12
-
13
-
14
-
15
-
16
-
17
-
18
-
19
-
20
-
21
-
22
-
23
-
24
-
25
-
26
-
27
-
28
-
29
-
30
-
31
-
32
-
33
-
34
-
35
-
36
-
37
-
38
-
39
-
40
-
41
-
42
-
43
-
44
-
45
-
46
-
47
-
48
-
49
-
50
-
51
-
52
-
53
-
54
-
55
-
56
-
57
-
58
-
59
-
60
-
61
-
62
-
63
-
64
-
65
-
66
-
67
-
68
-
69
-
70
-
71
-
72
-
73
-
74
-
75
-
76
-
77
-
78
-
79
-
80
-
81
-
82
-
83
-
84
-
85
-
86
-
87
-
88
-
89
-
90
-
91
-
92
-
93
-
94
-
95
-
96
-
97
-
98
-
99
-
100
-
101
-
102
-
103
-
104
-
105
-
106
-
107
-
108
-
109
-
110
-
111
-
112
-
113
-
114
-
115
-
 116
116 -
 117
117 -
 118
118 -
 119
119 -
 120
120 -
 121
121 -
 122
122 -
 123
123 -
 124
124 -
 125
125 -
 126
126 -
 127
127 -
 128
128 -
 129
129 -
 130
130 -
 131
131 -
 132
132 -
 133
133 -
 134
134 -
 135
135 -
 136
136 -
137
-
138
-
139
-
140
-
141
-
142
-
143
-
144
-
145
-
146
-
147
-
148
-
149
-
150
-
151
-
152
-
153
-
154
 |
 |
116
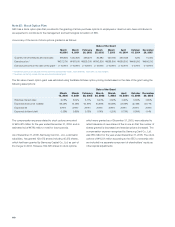
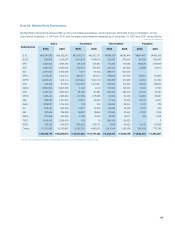
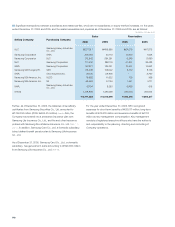
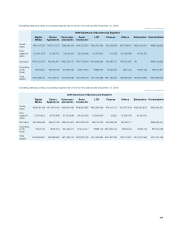
(B) Significant transactions among subsidiaries for the years ended December 31, 2006 and 2005, and the related receivables as of
December 31, 2006 and 2005, are as follows:
Selling Company Purchasing
Company
Sales Receivables
2006 2005 2006 2005
SII SEA \2,621,556 \1,676,658 \46,979 \26,437
SESK SELS 1,973,548 709,088 192,821 44,287
TSTC STA 978,057 697,960 64,246 43,284
SSKMT STA 881,494 583,569 84,099 5,848
SEH SELS 820,901 202,080 95,280 20,414
SELS SEF 758,010 406,793 22,697 20,414
TSED SCIC 654,289 420,703 40,047 30,844
SSEG SESK 625,352 365,489 28,664 34,447
SDMA SELS 612,718 431,450 78,128 84,184
SSI SII 584,015 246,459 45,906 8,594
SELS SEUK 538,778 111,161 8,503 3,779
SET SESK 536,355 206,247 23,077 31,400
SELS SEO 535,631 311,455 38,984 4,690
SELS SEG 482,308 216,713 8,033 7,924
SELS SEI 461,140 160,942 1,365 5,230
Others 16,734,668 15,547,196 1,761,341 1,853,756
\29,798,820 \22,293,963 \2,540,170 \2,225,532
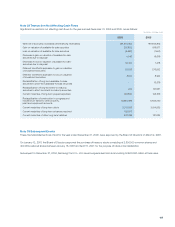
The inter company loans resulting from significant transactions among subsidiaries for the year ended December 31, 2006, amount to
\1,170,074 million (2005: \638,117 million).
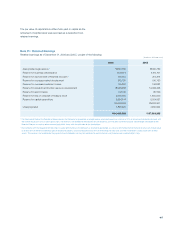
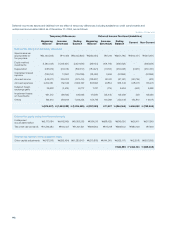
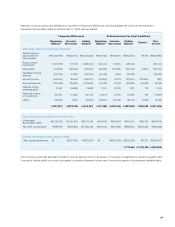
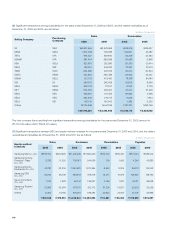
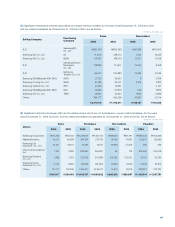
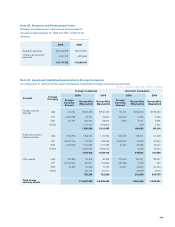
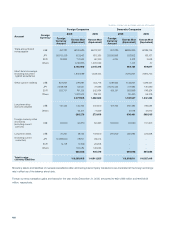
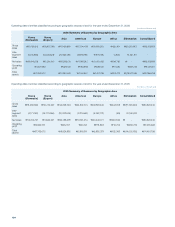
(C) Significant transactions between SEC and equity-method investees for the years ended December 31, 2006 and 2005, and the related
receivables and payables as of December 31, 2006 and 2005, are as follows:
Equity-method
Investees
Sales Purchases Receivables Payables
2006 2005 2006 2005 2006 2005 2006 2005
Samsung SDI Co., Ltd. \168,755 \237,925 \1,279,239 \1,650,220 \19,300 \24,347 \127,143 \189,104
Samsung Corning
Precision Glass
Co., Ltd.
5,793 11,255 724,817 544,036 100 1,455 4,254 42,680
Samsung Electro-
Mechanics Co., Ltd. 40,187 33,234 1,090,620 1,013,365 8,532 9,875 86,312 83,243
Samsung SDS
Co., Ltd. 46,032 36,739 693,679 619,709 13,477 10,079 126,857 128,190
Seoul Commtech.
Co., Ltd. 7,783 7,629 96,744 136,327 2,760 1,320 36,411 36,528
Samsung Techwin
Co., Ltd. 75,363 33,584 578,741 512,712 24,200 16,327 50,216 51,256
Others 12,255 15,185 379,001 189,484 25,952 27,003 42,737 43,896
\356,168 \375,551 \4,842,841 \4,665,853 \94,321 \90,406 \473,930 \574,897
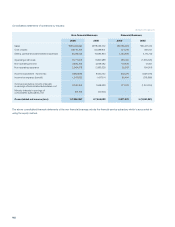
(In millions of Korean won)
(In millions of Korean won)