Samsung 2006 Annual Report Download - page 100
Download and view the complete annual report
Please find page 100 of the 2006 Samsung annual report below. You can navigate through the pages in the report by either clicking on the pages listed below, or by using the keyword search tool below to find specific information within the annual report.-
 1
1 -
2
-
3
-
4
-
5
-
6
-
7
-
8
-
9
-
10
-
11
-
12
-
13
-
14
-
15
-
16
-
17
-
18
-
19
-
20
-
21
-
22
-
23
-
24
-
25
-
26
-
27
-
28
-
29
-
30
-
31
-
32
-
33
-
34
-
35
-
36
-
37
-
38
-
39
-
40
-
41
-
42
-
43
-
44
-
45
-
46
-
47
-
48
-
49
-
50
-
51
-
52
-
53
-
54
-
55
-
56
-
57
-
58
-
59
-
60
-
61
-
62
-
63
-
64
-
65
-
66
-
67
-
68
-
69
-
70
-
71
-
72
-
73
-
74
-
75
-
76
-
77
-
78
-
79
-
80
-
81
-
82
-
83
-
84
-
85
-
86
-
87
-
88
-
89
-
 90
90 -
 91
91 -
 92
92 -
 93
93 -
 94
94 -
 95
95 -
 96
96 -
 97
97 -
 98
98 -
 99
99 -
 100
100 -
 101
101 -
 102
102 -
 103
103 -
 104
104 -
 105
105 -
 106
106 -
 107
107 -
 108
108 -
 109
109 -
 110
110 -
111
-
112
-
113
-
114
-
115
-
116
-
117
-
118
-
119
-
120
-
121
-
122
-
123
-
124
-
125
-
126
-
127
-
128
-
129
-
130
-
131
-
132
-
133
-
134
-
135
-
136
-
137
-
138
-
139
-
140
-
141
-
142
-
143
-
144
-
145
-
146
-
147
-
148
-
149
-
150
-
151
-
152
-
153
-
154
 |
 |
90
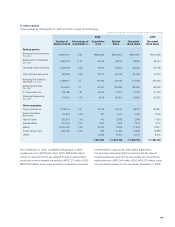
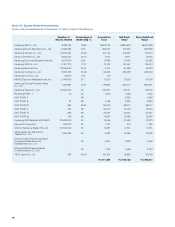
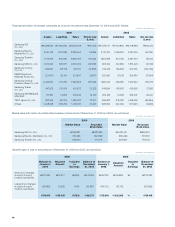
2) Non-listed equities
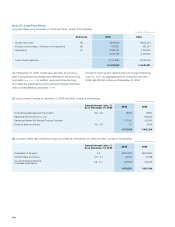
Non-listed equities as of December 31, 2006 and 2005, consist of the following:
2006 2005
Number of
Shares Owned
Percentage of
Ownership (%)
Acquisition
Cost
Net Book Value/
Market Value
Recorded
Book Value
Recorded
Book Value
Related parties
Samsung Petrochemical
Co., Ltd. 514,172 12.96 \8,040 \35,477 \8,040 \8,040
Samsung General Chemicals
Co., Ltd. 1,914,251 3.91 19,143 29,415 13,865 13,865
Samsung Venture Investment
Corporation 980,000 16.33 4,900 5,836 4,900 4,900
Samsung Life Insurance 131,588 0.66 92,112 51,909 92,112 92,112
iMarketKorea Inc. 380,000 14.1 1,900 5,754 1,900 1,900
International Cyber
Marketing, Inc ¹450,000 45 1,166 325 1,166 1,166
Samsung Everland Co., Ltd. ¹641,123 25.64 64,112 450,975 270,313 270,313
Allat Corporation ²300,000 30 1,500 3,476 3,476 1,892
Samsung Electronics
Manufacturing (UK) Ltd. ¹56,730,000 100 103,482 70,194 40,152 35,764
Others - - 24,228 17,628 13,005 22,789
Other companies
Kihyup Technology Banking
Corporation 1,000,000 17.24 5,000 6,356 5,000 5,000
Pusan Newport Co., Ltd. 1,135,307 1.31 5,676 5,008 5,676 5,676
Renault
Samsung Motors ²17,512,000 19.9 87,560 127,680 127,680 87,560
Bluebird Soft Inc. 140,000 17 10,199 2,249 2,441 2,441
SkyLife Broadcasting 600,000 0.71 3,344 482 3,000 3,344
Yong Pyong Resort
Co. Ltd. 400,000 1.05 2,000 1,184 2,000 2,000
TU Media Corp. 3,015,195 6.9 15,076 2,858 15,076 15,076
Symbian Ltd. 10,359,926 4.5 31,839 7,842 31,839 31,839
Beijing T3G Technology
Co., Ltd. - 16.26 9,164 1,745 9,164 7,732
Mybi Co., Ltd. ²72,000 2.43 1,080 312 312 1,080
MasterCard International
Inc. (Class B) ²201,269 0.15 2,241 12,152 12,152 5,467
Bad bank Harmony 68,278 - 68,278 47,931 47,931 11,439
Others 53,799 16,764 17,990 13,755
\615,839 \903,552 \729,190 \645,150
¹ As of December 31, 2006, these investments in affiliated companies were not valued using the equity method of accounting due to the immateriality of their total asset balances or
the Company’s inability to exercise significant influence over the operating and financial policies.
² As of December 31, 2006, certain investments which were valued at acquisition cost due to lack of reliability of basic information up to December 31, 2005, have been valued at fair
value using evaluation results from independent stock evaluation institution (Korea Investors Service, Inc.).
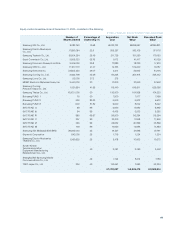
The following are the results of non-listed equities valued at fair value.
(In millions of Korean won, except for the number of shares and percentage)