Samsung 2006 Annual Report Download - page 83
Download and view the complete annual report
Please find page 83 of the 2006 Samsung annual report below. You can navigate through the pages in the report by either clicking on the pages listed below, or by using the keyword search tool below to find specific information within the annual report.-
 1
1 -
2
-
3
-
4
-
5
-
6
-
7
-
8
-
9
-
10
-
11
-
12
-
13
-
14
-
15
-
16
-
17
-
18
-
19
-
20
-
21
-
22
-
23
-
24
-
25
-
26
-
27
-
28
-
29
-
30
-
31
-
32
-
33
-
34
-
35
-
36
-
37
-
38
-
39
-
40
-
41
-
42
-
43
-
44
-
45
-
46
-
47
-
48
-
49
-
50
-
51
-
52
-
53
-
54
-
55
-
56
-
57
-
58
-
59
-
60
-
61
-
62
-
63
-
64
-
65
-
66
-
67
-
68
-
69
-
70
-
71
-
72
-
 73
73 -
 74
74 -
 75
75 -
 76
76 -
 77
77 -
 78
78 -
 79
79 -
 80
80 -
 81
81 -
 82
82 -
 83
83 -
 84
84 -
 85
85 -
 86
86 -
 87
87 -
 88
88 -
 89
89 -
 90
90 -
 91
91 -
 92
92 -
 93
93 -
94
-
95
-
96
-
97
-
98
-
99
-
100
-
101
-
102
-
103
-
104
-
105
-
106
-
107
-
108
-
109
-
110
-
111
-
112
-
113
-
114
-
115
-
116
-
117
-
118
-
119
-
120
-
121
-
122
-
123
-
124
-
125
-
126
-
127
-
128
-
129
-
130
-
131
-
132
-
133
-
134
-
135
-
136
-
137
-
138
-
139
-
140
-
141
-
142
-
143
-
144
-
145
-
146
-
147
-
148
-
149
-
150
-
151
-
152
-
153
-
154
 |
 |
73
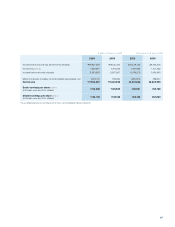
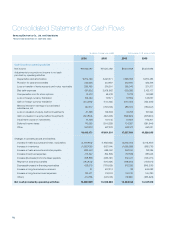
2006 2005 2006 2005
Cash flows from investing activities
Net increase in short-term financial instruments \564,016 \912,019 $607,122 $981,721
Proceeds from sale of short-term
available-for-sale securities 3,718,317 3,734,545 4,002,494 4,019,962
Acquisition of short-term available-for-sale securities (3,718,158) (3,148,892) (4,002,323) (3,389,550)
Net increase in other accounts and notes receivable (93,219) (53,147) (100,343) (57,209)
Proceeds from disposal of property, plant
and equipment 344,797 244,961 371,149 263,682
Acquisition of property, plant and equipment (11,738,291) (11,540,225) (12,635,405) (12,422,201)
Proceeds from sale of long-term available-
for-sale securities 22,625 69,750 24,354 75,081
Proceeds from sale of long-term held-to-maturity
securities 75,211 662,071 80,959 712,671
Proceeds from sale of equity-method investments 23,073 279,041 24,836 300,367
Acquisition of long-term available-for-sale securities (34,226) (60,564) (36,842) (65,193)
Acquisition of long-term held-to-maturity securities - (134,822) - (145,126)
Acquisition of equity-method investments (142,904) (46,362) (153,826) (49,905)
Others (118,948) 36,043 (128,038) 38,798
Net cash used in investing activities (11,097,707) (9,045,582) (11,945,863) (9,736,902)
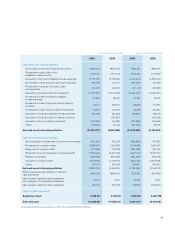
Cash flows from financing activities
Net proceeds from (repayment of) short-term borrowings (545,201) 815,328 (586,869) 877,640
Proceeds from long-term debts 3,086,201 3,350,653 3,322,068 3,606,731
Repayment of long-term debts (277,859) (76,378) (299,095) (82,215)
Repayment of current maturities of long-term debts (4,183,020) (5,231,209) (4,502,713) (5,631,011)
Payment of dividends (831,789) (849,364) (895,360) (914,278)
Acquisition of treasury stock (1,812,879) (2,149,370) (1,951,431) (2,313,638)
Others 675,317 873,856 726,931 940,642
Net cash used in financing activities (3,889,230) (3,266,484) (4,186,469) (3,516,129)
Effect of exchange rate changes on cash and
cash equivalents \30,125 (\69,574) $32,427 ($74,892)
Net increase in cash and cash equivalents
from changes in consolidated subsidiaries 15,423 6,277 16,602 6,757
Net increase in cash and cash equivalents 139,210 953,203 149,850 1,026,053
Cash and cash equivalents
Beginning of year 4,082,817 3,129,614 4,394,851 3,368,798
End of the year \4,222,027 \4,082,817 $4,544,701 $4,394,851
The accompanying notes are an integral part of these non-consolidated financial statements.
(In millions of Korean won (note3)) (In thousands of U.S. dollars (note3))