Samsung 2006 Annual Report Download - page 125
Download and view the complete annual report
Please find page 125 of the 2006 Samsung annual report below. You can navigate through the pages in the report by either clicking on the pages listed below, or by using the keyword search tool below to find specific information within the annual report.-
 1
1 -
2
-
3
-
4
-
5
-
6
-
7
-
8
-
9
-
10
-
11
-
12
-
13
-
14
-
15
-
16
-
17
-
18
-
19
-
20
-
21
-
22
-
23
-
24
-
25
-
26
-
27
-
28
-
29
-
30
-
31
-
32
-
33
-
34
-
35
-
36
-
37
-
38
-
39
-
40
-
41
-
42
-
43
-
44
-
45
-
46
-
47
-
48
-
49
-
50
-
51
-
52
-
53
-
54
-
55
-
56
-
57
-
58
-
59
-
60
-
61
-
62
-
63
-
64
-
65
-
66
-
67
-
68
-
69
-
70
-
71
-
72
-
73
-
74
-
75
-
76
-
77
-
78
-
79
-
80
-
81
-
82
-
83
-
84
-
85
-
86
-
87
-
88
-
89
-
90
-
91
-
92
-
93
-
94
-
95
-
96
-
97
-
98
-
99
-
100
-
101
-
102
-
103
-
104
-
105
-
106
-
107
-
108
-
109
-
110
-
111
-
112
-
113
-
114
-
 115
115 -
 116
116 -
 117
117 -
 118
118 -
 119
119 -
 120
120 -
 121
121 -
 122
122 -
 123
123 -
 124
124 -
 125
125 -
 126
126 -
 127
127 -
 128
128 -
 129
129 -
 130
130 -
 131
131 -
 132
132 -
 133
133 -
 134
134 -
 135
135 -
136
-
137
-
138
-
139
-
140
-
141
-
142
-
143
-
144
-
145
-
146
-
147
-
148
-
149
-
150
-
151
-
152
-
153
-
154
 |
 |
115
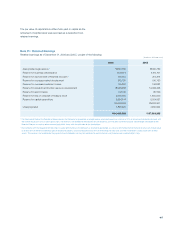
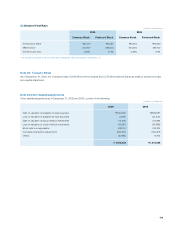
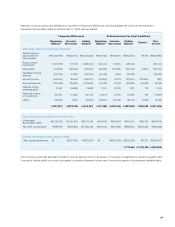
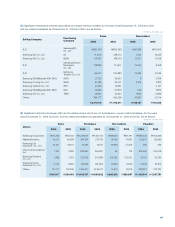
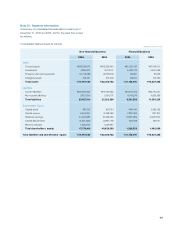
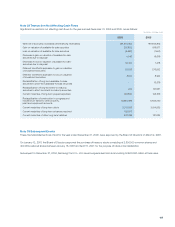
Note 28 : Related Party Transactions
(A) Significant transactions between SEC and its consolidated subsidiaries, which have been eliminated during consolidation, for the
years ended December 31, 2006 and 2005, and the related receivables and payables as of December 31, 2006 and 2005, are as follows:
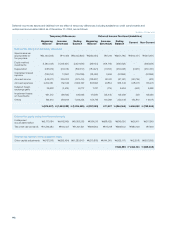
Subsidiaries
Sales Purchases Receivables ¹Payables
2006 2005 2006 2005 2006 2005 2006 2005
SJC \3,798,069 \3,352,043 \2,100,737 \2,312,721 \194,106 \280,444 \244,467 \163,103
SLCD 930,983 1,060,137 1,940,542 1,049,016 327,564 375,505 161,129 185,947
STA 1,248,304 1,966,733 401,378 415,867 110,333 179,195 166,839 209,793
SET 3,987,161 3,386,002 578,541 357,847 334,475 241,926 42,696 20,817
SSI 6,797,940 6,412,590 9,471 10,025 589,577 642,275 - -
SAPL 2,318,294 3,015,172 880,677 760,714 189,049 201,303 36,921 50,994
SEHK 2,293,407 1,941,144 1,053,224 1,050,716 246,390 210,525 40,261 54,627
SEA 619,432 813,974 1,310,381 1,301,741 138,846 101,975 65,619 98,303
SSEG 3,866,865 3,903,865 5,405 4,072 371,801 445,707 3,324 3,327
SEO 1,726,447 1,893,544 58,595 40,961 292,635 263,216 20,103 12,991
SEUK 1,386,474 1,485,684 122,189 278,365 40,646 34,768 54,091 29,351
SEF 989,792 1,021,812 31,421 15,802 77,575 31,915 24,730 5,611
SSEL 1,289,931 1,175,766 148 512 219,342 85,251 3,702 228
SII 678,497 590,364 15,517 13,390 66,468 15,429 2,010 704
SEI 797,545 736,838 45,937 18,663 30,600 81,951 41,100 7,316
SELS 340,656 367,469 3,260 5,836 87,094 56,171 184 1,048
TSTC 2,549,547 2,033,053 179 15 236,333 151,023 - 3
SESC 125,752 234,379 290,226 263,715 11,936 56,925 41,010 25,968
Others 10,750,083 10,139,345 5,063,732 4,891,205 1,301,644 1,192,694 935,168 776,736
\46,495,179 \45,529,914 \13,911,560 \12,791,183 \4,866,414 \4,648,198 \1,883,354 \1,646,867
¹ Includes the transferred receivables of consolidated subsidiaries as of December 31, 2006 and 2005.
(In millions of korean won)