Samsung 2006 Annual Report Download - page 143
Download and view the complete annual report
Please find page 143 of the 2006 Samsung annual report below. You can navigate through the pages in the report by either clicking on the pages listed below, or by using the keyword search tool below to find specific information within the annual report.-
 1
1 -
2
-
3
-
4
-
5
-
6
-
7
-
8
-
9
-
10
-
11
-
12
-
13
-
14
-
15
-
16
-
17
-
18
-
19
-
20
-
21
-
22
-
23
-
24
-
25
-
26
-
27
-
28
-
29
-
30
-
31
-
32
-
33
-
34
-
35
-
36
-
37
-
38
-
39
-
40
-
41
-
42
-
43
-
44
-
45
-
46
-
47
-
48
-
49
-
50
-
51
-
52
-
53
-
54
-
55
-
56
-
57
-
58
-
59
-
60
-
61
-
62
-
63
-
64
-
65
-
66
-
67
-
68
-
69
-
70
-
71
-
72
-
73
-
74
-
75
-
76
-
77
-
78
-
79
-
80
-
81
-
82
-
83
-
84
-
85
-
86
-
87
-
88
-
89
-
90
-
91
-
92
-
93
-
94
-
95
-
96
-
97
-
98
-
99
-
100
-
101
-
102
-
103
-
104
-
105
-
106
-
107
-
108
-
109
-
110
-
111
-
112
-
113
-
114
-
115
-
116
-
117
-
118
-
119
-
120
-
121
-
122
-
123
-
124
-
125
-
126
-
127
-
128
-
129
-
130
-
131
-
132
-
 133
133 -
 134
134 -
 135
135 -
 136
136 -
 137
137 -
 138
138 -
 139
139 -
 140
140 -
 141
141 -
 142
142 -
 143
143 -
 144
144 -
 145
145 -
 146
146 -
 147
147 -
 148
148 -
 149
149 -
 150
150 -
 151
151 -
 152
152 -
 153
153 -
154
 |
 |
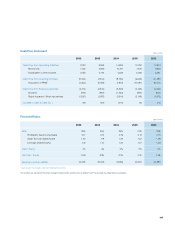
133
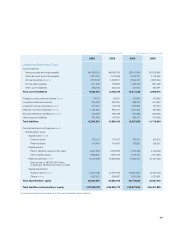
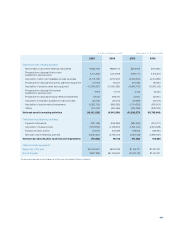
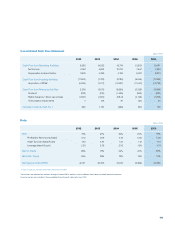
(Billion KRW)
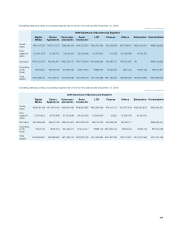
Consolidated Cash Flow Statement
2002 2003 2004 2005 2006
Cash Flow from Operating Activities 9,586 14,565 16,744 13,329 15,081
Net Income 7,053 5,962 10,790 7,640 7,926
Depreciation & Armortization 3,676 4,299 5,185 6,020 6,873
Cash Flow from Investing Activities (11,505) (7,728) (8,183) (9,046) (11,098)
Acquisition of PP&E (5,064) (7,701) (10,497) (11,540) (11,738)
Cash Flow from Financing Activities 2,306 (5,178) (9,639) (3,266) (3,889)
Dividend (913) (910) (1,596) (849) (832)
Rights Issuance / Stock repurchase (1,500) (1,979) (3,841) (2,149) (1,813)
Consolidation adjustments 4 108 81 (63) 46
Increase in Cash & Cash Eq. *392 1,767 (996) 953 139
(Billion KRW)
Ratio
2002 2003 2004 2005 2006
ROE 31% 21% 32% 20% 18%
Profitability (Net Income/Sales) 0.12 0.09 0.13 0.09 0.09
Asset Turnover (Sales/Asset) 1.02 0.97 1.20 1.12 1.10
Leverage (Asset/Equity) 2.55 2.39 2.06 1.84 1.74
Debt to Equity 99% 78% 49% 40% 30%
Net Debt / Equity 65% 38% 18% 15% 10%
Earnings per share (KRW) 42,011 36,376 67,916 49,969 52,880
* Cash & Cash Eq. includes short-term financial instruments
The numbers are adjusted for the latest change in Korean GAAP and thus may be different from those in audited financial statements
Financial sectors are included in the consolidated base financial statements from 2000