Samsung 2006 Annual Report Download - page 132
Download and view the complete annual report
Please find page 132 of the 2006 Samsung annual report below. You can navigate through the pages in the report by either clicking on the pages listed below, or by using the keyword search tool below to find specific information within the annual report.-
 1
1 -
2
-
3
-
4
-
5
-
6
-
7
-
8
-
9
-
10
-
11
-
12
-
13
-
14
-
15
-
16
-
17
-
18
-
19
-
20
-
21
-
22
-
23
-
24
-
25
-
26
-
27
-
28
-
29
-
30
-
31
-
32
-
33
-
34
-
35
-
36
-
37
-
38
-
39
-
40
-
41
-
42
-
43
-
44
-
45
-
46
-
47
-
48
-
49
-
50
-
51
-
52
-
53
-
54
-
55
-
56
-
57
-
58
-
59
-
60
-
61
-
62
-
63
-
64
-
65
-
66
-
67
-
68
-
69
-
70
-
71
-
72
-
73
-
74
-
75
-
76
-
77
-
78
-
79
-
80
-
81
-
82
-
83
-
84
-
85
-
86
-
87
-
88
-
89
-
90
-
91
-
92
-
93
-
94
-
95
-
96
-
97
-
98
-
99
-
100
-
101
-
102
-
103
-
104
-
105
-
106
-
107
-
108
-
109
-
110
-
111
-
112
-
113
-
114
-
115
-
116
-
117
-
118
-
119
-
120
-
121
-
 122
122 -
 123
123 -
 124
124 -
 125
125 -
 126
126 -
 127
127 -
 128
128 -
 129
129 -
 130
130 -
 131
131 -
 132
132 -
 133
133 -
 134
134 -
 135
135 -
 136
136 -
 137
137 -
 138
138 -
 139
139 -
 140
140 -
 141
141 -
 142
142 -
143
-
144
-
145
-
146
-
147
-
148
-
149
-
150
-
151
-
152
-
153
-
154
 |
 |
122
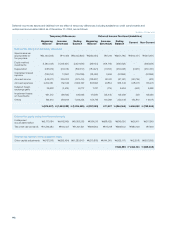
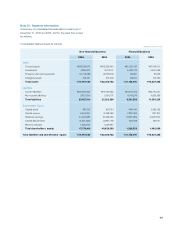
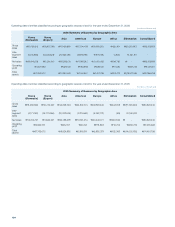
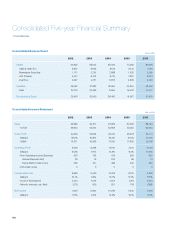
Consolidated statements of operations by industry:
Non-financial Business Financial Business
2006 2005 2006 2005
Sales \83,243,925 \78,233,772 \2,195,979 \2,401,072
Cost of sales 59,130,794 54,589,941 521,310 667,047
Selling, general and administrative expenses 15,336,123 14,692,843 1,444,338 3,110,745
Operating profit (loss) 8,777,008 8,950,988 230,331 (1,376,720)
Non-operating income 3,380,706 2,978,082 157,446 41,507
Non-operating expenses 2,564,878 2,893,328 25,503 184,906
Income (loss) before income tax 9,592,836 9,035,742 362,274 (1,520,119)
Income tax expense (benefit) 1,543,583 1,437,114 90,404 (218,868)
Income (loss) before minority interests
in earnings ofconsolidated subsidiaries, net 8,049,253 7,598,628 271,870 (1,301,251)
Minority interests in earnings of
consolidated subsidiaries, net 123,166 (41,464) - -
Consolidated net income (loss) \7,926,087 \7,640,092 \271,870 \(1,301,251)
The above consolidated financial statements of the non-financial business include the financial service subsidiary which is accounted for
using the equity method.
(In millions of Korean won)