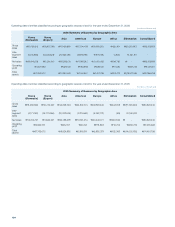
Samsung 2006 Annual Report Download - page 136
Download and view the complete annual report
Please find page 136 of the 2006 Samsung annual report below. You can navigate through the pages in the report by either clicking on the pages listed below, or by using the keyword search tool below to find specific information within the annual report.-
 1
1 -
2
-
3
-
4
-
5
-
6
-
7
-
8
-
9
-
10
-
11
-
12
-
13
-
14
-
15
-
16
-
17
-
18
-
19
-
20
-
21
-
22
-
23
-
24
-
25
-
26
-
27
-
28
-
29
-
30
-
31
-
32
-
33
-
34
-
35
-
36
-
37
-
38
-
39
-
40
-
41
-
42
-
43
-
44
-
45
-
46
-
47
-
48
-
49
-
50
-
51
-
52
-
53
-
54
-
55
-
56
-
57
-
58
-
59
-
60
-
61
-
62
-
63
-
64
-
65
-
66
-
67
-
68
-
69
-
70
-
71
-
72
-
73
-
74
-
75
-
76
-
77
-
78
-
79
-
80
-
81
-
82
-
83
-
84
-
85
-
86
-
87
-
88
-
89
-
90
-
91
-
92
-
93
-
94
-
95
-
96
-
97
-
98
-
99
-
100
-
101
-
102
-
103
-
104
-
105
-
106
-
107
-
108
-
109
-
110
-
111
-
112
-
113
-
114
-
115
-
116
-
117
-
118
-
119
-
120
-
121
-
122
-
123
-
124
-
125
-
 126
126 -
 127
127 -
 128
128 -
 129
129 -
 130
130 -
 131
131 -
 132
132 -
 133
133 -
 134
134 -
 135
135 -
 136
136 -
 137
137 -
 138
138 -
 139
139 -
 140
140 -
 141
141 -
 142
142 -
 143
143 -
 144
144 -
 145
145 -
 146
146 -
147
-
148
-
149
-
150
-
151
-
152
-
153
-
154
 |
 |
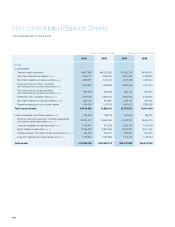
126
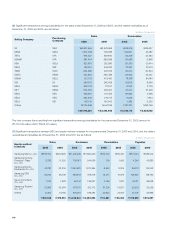
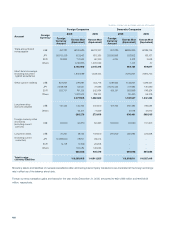
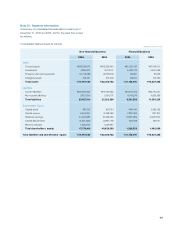
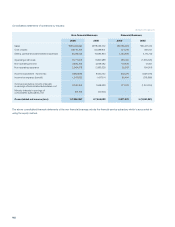
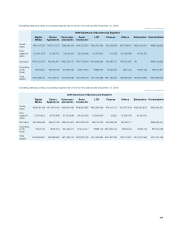
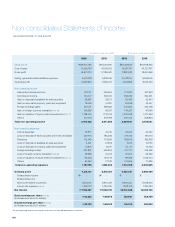
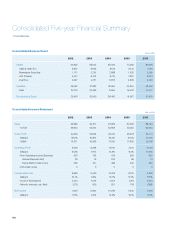
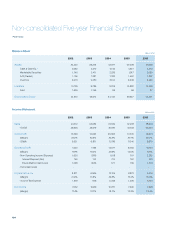
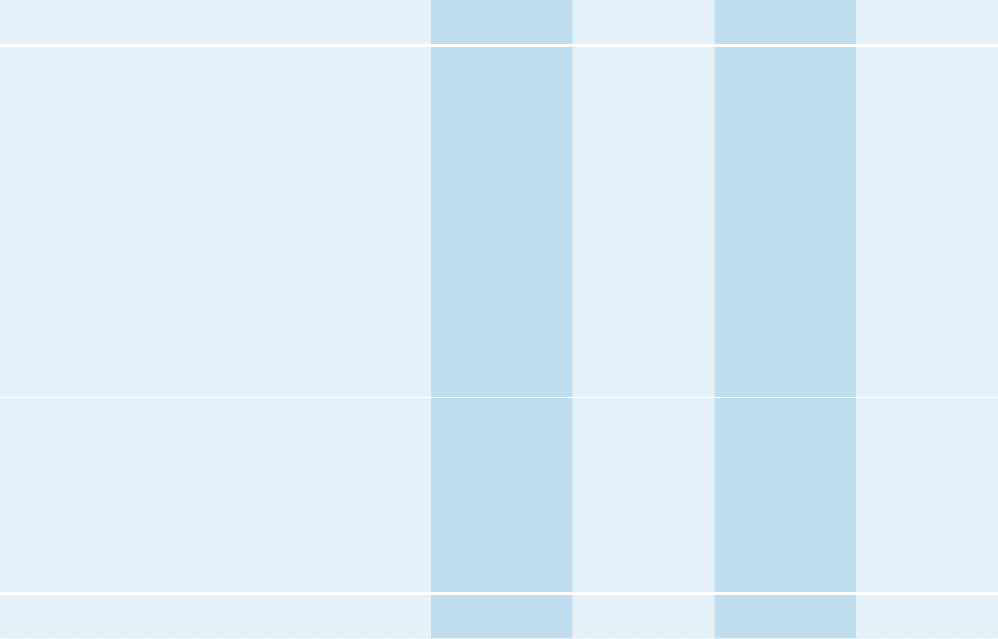
Non-consolidated Balance Sheets
2006 2005 2006 2005
Assets
Current assets
Cash and cash equivalents \977,989 \1,053,552 $1,052,733 $1,134,071
Short-term financial instruments (Note 4) 3,335,141 3,897,931 3,590,033 4,195,835
Short-term available-for-sale securities (Note 5) 2,058,781 1,917,122 2,216,126 2,063,640
Trade accounts and notes receivable,
net of allowance for doubtful accounts (Note 6) 1,842,439 1,496,939 1,983,250 1,611,344
Other accounts and notes receivable,
net of allowance for doubtful accounts (Note 6) 864,669 842,828 930,752 907,242
Inventories, net of valuation losses (Note 7) 3,219,474 2,909,447 3,465,526 3,131,805
Short-term deferred income tax assets (Note 24) 1,155,410 907,680 1,243,714 977,051
Prepaid expenses and other current assets 1,190,906 1,197,812 1,281,923 1,289,358
Total current assets 14,644,809 14,223,311 15,764,057 15,310,346
Lease receivables under finance lease (Note 8) 223,488 269,179 240,569 289,751
Property, plant and equipment, including revaluations,
net of accumulated depreciation (Note 11) 28,820,442 24,650,194 31,023,081 26,534,116
Long-term available-for-sale securities (Note 9) 1,148,944 977,409 1,236,753 1,052,109
Equity-method investments (Note 10) 11,265,083 8,891,880 12,126,031 9,571,453
Intangible assets, net of accumulated amortization (Note 12) 522,378 465,801 562,301 501,400
Long-term deposits and other assets, net (Note 13) 1,183,984 1,060,996 1,274,472 1,142,084
Total assets \57,809,128 \50,538,770 $62,227,264 $54,401,259
Years Ended December 31, 2006 and 2005
(In millions of Korean won (note3)) (In thousands of U.S. dollars (note3))