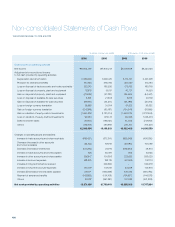
Samsung 2006 Annual Report Download - page 130
Download and view the complete annual report
Please find page 130 of the 2006 Samsung annual report below. You can navigate through the pages in the report by either clicking on the pages listed below, or by using the keyword search tool below to find specific information within the annual report.-
 1
1 -
2
-
3
-
4
-
5
-
6
-
7
-
8
-
9
-
10
-
11
-
12
-
13
-
14
-
15
-
16
-
17
-
18
-
19
-
20
-
21
-
22
-
23
-
24
-
25
-
26
-
27
-
28
-
29
-
30
-
31
-
32
-
33
-
34
-
35
-
36
-
37
-
38
-
39
-
40
-
41
-
42
-
43
-
44
-
45
-
46
-
47
-
48
-
49
-
50
-
51
-
52
-
53
-
54
-
55
-
56
-
57
-
58
-
59
-
60
-
61
-
62
-
63
-
64
-
65
-
66
-
67
-
68
-
69
-
70
-
71
-
72
-
73
-
74
-
75
-
76
-
77
-
78
-
79
-
80
-
81
-
82
-
83
-
84
-
85
-
86
-
87
-
88
-
89
-
90
-
91
-
92
-
93
-
94
-
95
-
96
-
97
-
98
-
99
-
100
-
101
-
102
-
103
-
104
-
105
-
106
-
107
-
108
-
109
-
110
-
111
-
112
-
113
-
114
-
115
-
116
-
117
-
118
-
119
-
 120
120 -
 121
121 -
 122
122 -
 123
123 -
 124
124 -
 125
125 -
 126
126 -
 127
127 -
 128
128 -
 129
129 -
 130
130 -
 131
131 -
 132
132 -
 133
133 -
 134
134 -
 135
135 -
 136
136 -
 137
137 -
 138
138 -
 139
139 -
 140
140 -
141
-
142
-
143
-
144
-
145
-
146
-
147
-
148
-
149
-
150
-
151
-
152
-
153
-
154
 |
 |
120
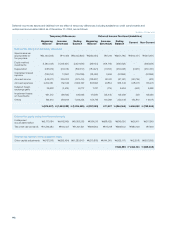
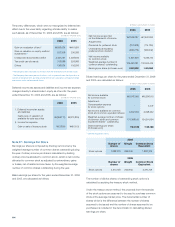
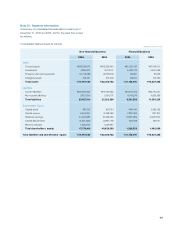
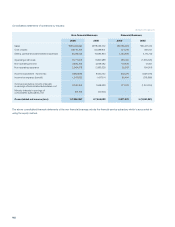
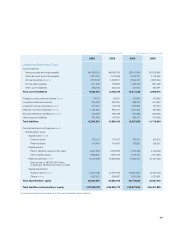
Monetary assets and liabilities of overseas subsidiaries after eliminating intercompany transactions are translated at the foreign exchange
rate in effect as of the balance sheet date.
Foreign currency translation gains and losses for the year ended December 31, 2006, amounted to \214,686 million and \109,494
million, respectively.
Account Foreign
Currency
Foreign Companies Domestic Companies
2006 2005 2006 2005
Foreign
Currency
Amount
Korean Won
(Equivalent)
Korean Won
(Equivalent)
Foreign
Currency
Amount
Korean Won
(Equivalent)
Korean Won
(Equivalent)
Trade accounts and
notes payable US$ 441,787 \410,685 \273,347 321,289 \298,669 \289,135
JPY 118,179,229 923,962 876,335 33,619,998 262,852 193,127
EUR 90,869 111,063 60,340 4,024 4,918 2,508
Others 1,749,856 1,605,396 1,745 47
3,195,566 2,815,418 568,184 484,817
Short-term borrowings,
(including document
against acceptance)
1,935,889 1,533,422 3,760,967 3,694,725
Other current liabilities US$ 623,927 579,997 455,776 1,219,833 1,133,957 1,039,421
JPY 7,038,768 55,031 37,986 27,076,435 211,692 120,980
EUR 622,731 761,135 552,994 426,241 520,968 196,524
Others 1,081,403 786,104 80,430 55,319
2,477,566 1,832,860 1,947,047 1,412,244
Long-term other
accounts payable US$ 151,426 140,765 202,600 317,753 295,383 316,533
Others 64,511 71,059 41,078 51,972
205,276 273,659 336,461 368,505
Foreign currency notes
and bonds
(including current
portions)
US$ 50,000 46,480 50,650 100,000 92,960 101,300
Long-term debts, US$ 31,351 29,144 133,600 270,000 250,992 225,828
(including current
maturities) JPY 10,088,000 78,871 99,013 - -
EUR 14,178 17,329 25,908 - -
Others 103,484 146,995 - -
228,828 405,516 250,992 225,828
Total foreign
currency liabilities \8,089,605 \6,911,525 \6,956,611 \6,287,419
(In millions of Korean won and foreign currencies in thousands)