Samsung 2006 Annual Report Download - page 102
Download and view the complete annual report
Please find page 102 of the 2006 Samsung annual report below. You can navigate through the pages in the report by either clicking on the pages listed below, or by using the keyword search tool below to find specific information within the annual report.-
 1
1 -
2
-
3
-
4
-
5
-
6
-
7
-
8
-
9
-
10
-
11
-
12
-
13
-
14
-
15
-
16
-
17
-
18
-
19
-
20
-
21
-
22
-
23
-
24
-
25
-
26
-
27
-
28
-
29
-
30
-
31
-
32
-
33
-
34
-
35
-
36
-
37
-
38
-
39
-
40
-
41
-
42
-
43
-
44
-
45
-
46
-
47
-
48
-
49
-
50
-
51
-
52
-
53
-
54
-
55
-
56
-
57
-
58
-
59
-
60
-
61
-
62
-
63
-
64
-
65
-
66
-
67
-
68
-
69
-
70
-
71
-
72
-
73
-
74
-
75
-
76
-
77
-
78
-
79
-
80
-
81
-
82
-
83
-
84
-
85
-
86
-
87
-
88
-
89
-
90
-
91
-
 92
92 -
 93
93 -
 94
94 -
 95
95 -
 96
96 -
 97
97 -
 98
98 -
 99
99 -
 100
100 -
 101
101 -
 102
102 -
 103
103 -
 104
104 -
 105
105 -
 106
106 -
 107
107 -
 108
108 -
 109
109 -
 110
110 -
 111
111 -
 112
112 -
113
-
114
-
115
-
116
-
117
-
118
-
119
-
120
-
121
-
122
-
123
-
124
-
125
-
126
-
127
-
128
-
129
-
130
-
131
-
132
-
133
-
134
-
135
-
136
-
137
-
138
-
139
-
140
-
141
-
142
-
143
-
144
-
145
-
146
-
147
-
148
-
149
-
150
-
151
-
152
-
153
-
154
 |
 |

92
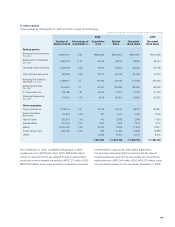
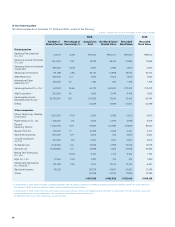
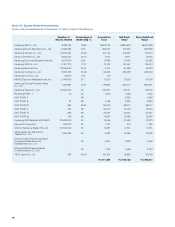
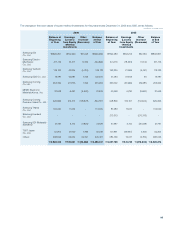
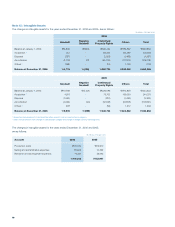
Note 10 : Equity-Method Investments
Equity-method investments as of December 31, 2006, consist of the following:
Number of
Shares Owned
Percentage of
Ownership (%)
Acquisition
Cost
Net Book
Value
Recorded Book
Value
Samsung SDI Co., Ltd. 9,282,753 19.68 \423,722 \925,819 \920,389
Samsung Electro-Mechanics Co., Ltd. 17,693,084 22.8 359,237 407,018 394,899
Samsung Techwin Co., Ltd. 19,604,254 25.46 211,726 216,657 216,118
Seoul Commtech Co., Ltd. 3,933,320 35.76 9,172 47,171 46,120
Samsung Economic Research Institute 3,576,000 29.8 17,880 24,153 23,535
Samsung SDS Co., Ltd. 11,977,770 21.27 12,753 151,457 125,614
Samsung Networks Inc. 23,955,550 23.07 5,214 46,368 45,024
Samsung Corning Co., Ltd. 3,665,708 45.29 94,263 233,498 233,484
Samsung Lions Co., Ltd. 55,000 27.5 275 - -
MEMC Electronic Materials Korea, Inc. 3,440,000 20 17,200 37,639 37,639
Samsung Corning Precision Glass
Co., Ltd. 7,406,991 42.47 179,993 922,347 894,801
Samsung Thales Co., Ltd. 13,500,000 50 135,000 116,121 116,075
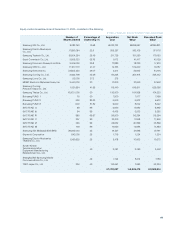
Bokwang FUND Ⅰ75 50 7,500 7,428 7,422
SVIC FUND Ⅱ- 99 - 3,563 3,563
SVIC FUND Ⅲ42 99 4,158 2,884 2,884
SVIC FUND Ⅳ985 65.67 98,500 98,077 98,077
SVIC FUND Ⅴ297 99 29,700 14,000 14,000
SVIC FUND Ⅵ265 99 26,532 24,337 24,337
SVIC FUND Ⅶ149 99 14,850 15,096 15,096
Samsung SDI (Malaysia) SDN. BHD. 38,595,040 25 18,445 31,492 27,679
Skyworld Corporation. 530,000 25 1,712 974 1,195
Siltronic Samsung Wafers Pte. Ltd. 131,534,000 50 79,681 77,751 77,751
Samsung Electro-Mechanics
Thailand Co., Ltd. 1,060,625 25 3,462 13,865 10,808
Syrian-Korean Telecommunication
Equipments Manufacturing
Establishment Co., Ltd.
- 49 2,061 3,683 3,356
Shanghai Bell Samsung Mobile
Communications Co., Ltd. - 49 7,742 4,458 3,233
TSST Japan Co., Ltd. 294 49.03 150,451 19,926 50,518
\1,911,229 \3,445,782 \3,393,617
(In millions of Korean won, except for the number of shares and percentage)