Samsung 2006 Annual Report Download - page 3
Download and view the complete annual report
Please find page 3 of the 2006 Samsung annual report below. You can navigate through the pages in the report by either clicking on the pages listed below, or by using the keyword search tool below to find specific information within the annual report.-
 1
1 -
 2
2 -
 3
3 -
 4
4 -
 5
5 -
 6
6 -
 7
7 -
 8
8 -
 9
9 -
 10
10 -
 11
11 -
 12
12 -
 13
13 -
 14
14 -
15
-
16
-
17
-
18
-
19
-
20
-
21
-
22
-
23
-
24
-
25
-
26
-
27
-
28
-
29
-
30
-
31
-
32
-
33
-
34
-
35
-
36
-
37
-
38
-
39
-
40
-
41
-
42
-
43
-
44
-
45
-
46
-
47
-
48
-
49
-
50
-
51
-
52
-
53
-
54
-
55
-
56
-
57
-
58
-
59
-
60
-
61
-
62
-
63
-
64
-
65
-
66
-
67
-
68
-
69
-
70
-
71
-
72
-
73
-
74
-
75
-
76
-
77
-
78
-
79
-
80
-
81
-
82
-
83
-
84
-
85
-
86
-
87
-
88
-
89
-
90
-
91
-
92
-
93
-
94
-
95
-
96
-
97
-
98
-
99
-
100
-
101
-
102
-
103
-
104
-
105
-
106
-
107
-
108
-
109
-
110
-
111
-
112
-
113
-
114
-
115
-
116
-
117
-
118
-
119
-
120
-
121
-
122
-
123
-
124
-
125
-
126
-
127
-
128
-
129
-
130
-
131
-
132
-
133
-
134
-
135
-
136
-
137
-
138
-
139
-
140
-
141
-
142
-
143
-
144
-
145
-
146
-
147
-
148
-
149
-
150
-
151
-
152
-
153
-
154
 |
 |
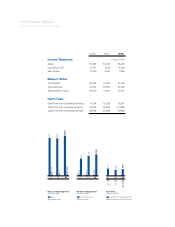
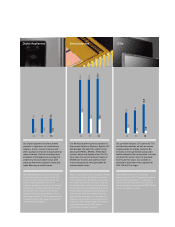
Sales 81,963 80,630 85,426
Operating Profit 11,761 7,575 9,008
Net Income 10,790 7,640 7,926
Cash Flow from Operating Activities 16,744 13,329 15,081
Cash Flow from Investing Activities (8,183) (9,046) (11,098)
Cash Flow from Financing Activities (9,639) (3,266) (3,889)
Total Assets 69,005 74.462 81,366
Total Liabilities 32,604 32,854 33,426
Shareholders’ Equity 36,400 41,607 47,940
Balance Sheet
Cash Flows
Income Statement
2004 2005 2006
2006 Financial Highlights
Samsung Electronics and Consolidated Subsidiaries
(in billions of KRW)
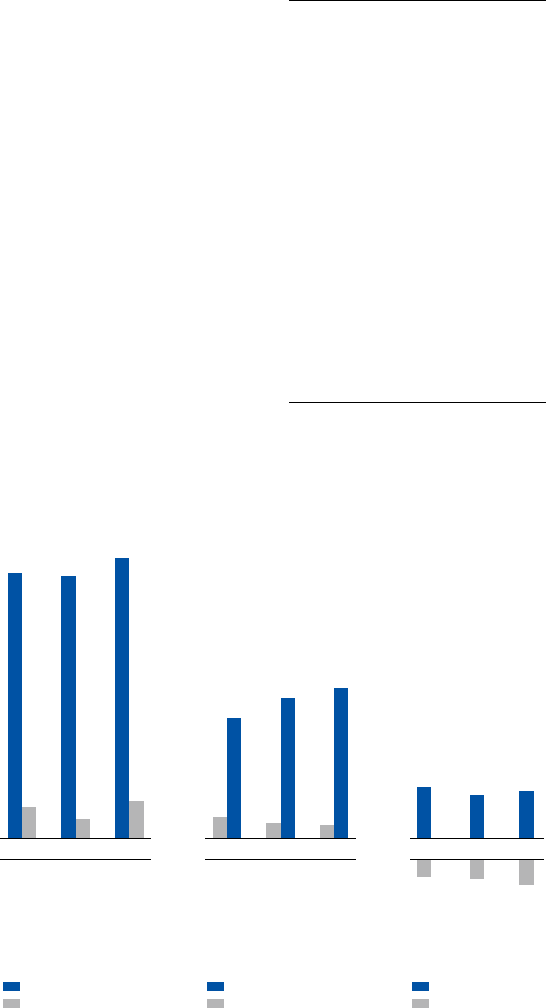
85.4
06
9.0
Sales and Operating Profit
(in trillions of KRW)
Net Debt-to-Equity Ratio
(in trillions of KRW)
04 05
82.0
80.6
11.8
7.6
36.4
6.7
41.6
6.4
4.7
47.9
04 05
06
16.7
13.3
15.1
-11.1
-9.0
-8.2
06
0504
Sales
Operating Profit
Cash Flow from Operating Activities
Cash Flow from Investing Activities
Shareholders’ Equity
Total Liabilities
Cash Flows
(in trillions of KRW)