Samsung 2006 Annual Report Download - page 81
Download and view the complete annual report
Please find page 81 of the 2006 Samsung annual report below. You can navigate through the pages in the report by either clicking on the pages listed below, or by using the keyword search tool below to find specific information within the annual report.-
 1
1 -
2
-
3
-
4
-
5
-
6
-
7
-
8
-
9
-
10
-
11
-
12
-
13
-
14
-
15
-
16
-
17
-
18
-
19
-
20
-
21
-
22
-
23
-
24
-
25
-
26
-
27
-
28
-
29
-
30
-
31
-
32
-
33
-
34
-
35
-
36
-
37
-
38
-
39
-
40
-
41
-
42
-
43
-
44
-
45
-
46
-
47
-
48
-
49
-
50
-
51
-
52
-
53
-
54
-
55
-
56
-
57
-
58
-
59
-
60
-
61
-
62
-
63
-
64
-
65
-
66
-
67
-
68
-
69
-
70
-
 71
71 -
 72
72 -
 73
73 -
 74
74 -
 75
75 -
 76
76 -
 77
77 -
 78
78 -
 79
79 -
 80
80 -
 81
81 -
 82
82 -
 83
83 -
 84
84 -
 85
85 -
 86
86 -
 87
87 -
 88
88 -
 89
89 -
 90
90 -
 91
91 -
92
-
93
-
94
-
95
-
96
-
97
-
98
-
99
-
100
-
101
-
102
-
103
-
104
-
105
-
106
-
107
-
108
-
109
-
110
-
111
-
112
-
113
-
114
-
115
-
116
-
117
-
118
-
119
-
120
-
121
-
122
-
123
-
124
-
125
-
126
-
127
-
128
-
129
-
130
-
131
-
132
-
133
-
134
-
135
-
136
-
137
-
138
-
139
-
140
-
141
-
142
-
143
-
144
-
145
-
146
-
147
-
148
-
149
-
150
-
151
-
152
-
153
-
154
 |
 |

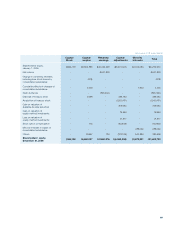
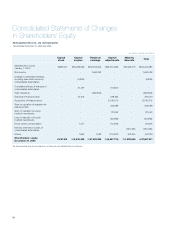
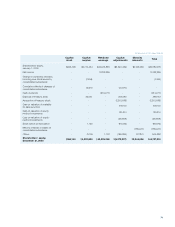
71
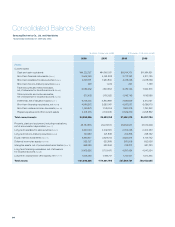
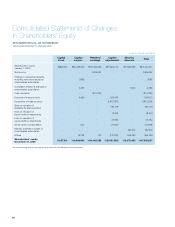
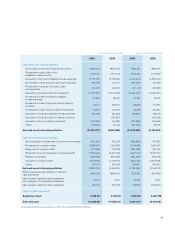
Capital
stock
Capital
surplus
Retained
earnings
Capital
adjustments
Minority
interests Total
Shareholders’ equity,
January 1, 2005 $966,108 $6,716,454 $32,913,836 ($3,520,439) $2,106,259 $39,182,218
Net income - - 8,223,996 - - 8,223,996
Change in ownership interests,
including new stock issues by
consolidated subsidiaries
- (7,466) - - - (7,466)
Cumulative effects of changes of
consolidated subsidiaries - 75,670 - (75,670) - -
Cash dividends - - (914,277) - - (914,277)
Disposal of treasury stock - 35,061 - 364,082 - 399,143
Acquisition of treasury stock - - - (2,313,639) - (2,313,639)
Gain on valuation of available-
for-sale securities - - - 479,104 - 479,104
Gain on valuation of equity-
method investments - - - 130,314 - 130,314
Loss on valuation of equity-
method investments - - - (68,858) - (68,858)
Stock option compensation - 1,160 - (81,236) - (80,076)
Minority interests in losses of
consolidated subsidiaries - - - - (789,047) (789,047)
Others - 2,006 1,703 (185,685) 727,874 545,898
Shareholders’ equity,
December 31, 2005 $966,108 $6,822,885 $40,225,258 $(5,272,027) $2,045,086 $44,787,310
(In thousands of U.S. dollars (Note 3))