Samsung 2006 Annual Report Download - page 106
Download and view the complete annual report
Please find page 106 of the 2006 Samsung annual report below. You can navigate through the pages in the report by either clicking on the pages listed below, or by using the keyword search tool below to find specific information within the annual report.-
 1
1 -
2
-
3
-
4
-
5
-
6
-
7
-
8
-
9
-
10
-
11
-
12
-
13
-
14
-
15
-
16
-
17
-
18
-
19
-
20
-
21
-
22
-
23
-
24
-
25
-
26
-
27
-
28
-
29
-
30
-
31
-
32
-
33
-
34
-
35
-
36
-
37
-
38
-
39
-
40
-
41
-
42
-
43
-
44
-
45
-
46
-
47
-
48
-
49
-
50
-
51
-
52
-
53
-
54
-
55
-
56
-
57
-
58
-
59
-
60
-
61
-
62
-
63
-
64
-
65
-
66
-
67
-
68
-
69
-
70
-
71
-
72
-
73
-
74
-
75
-
76
-
77
-
78
-
79
-
80
-
81
-
82
-
83
-
84
-
85
-
86
-
87
-
88
-
89
-
90
-
91
-
92
-
93
-
94
-
95
-
 96
96 -
 97
97 -
 98
98 -
 99
99 -
 100
100 -
 101
101 -
 102
102 -
 103
103 -
 104
104 -
 105
105 -
 106
106 -
 107
107 -
 108
108 -
 109
109 -
 110
110 -
 111
111 -
 112
112 -
 113
113 -
 114
114 -
 115
115 -
 116
116 -
117
-
118
-
119
-
120
-
121
-
122
-
123
-
124
-
125
-
126
-
127
-
128
-
129
-
130
-
131
-
132
-
133
-
134
-
135
-
136
-
137
-
138
-
139
-
140
-
141
-
142
-
143
-
144
-
145
-
146
-
147
-
148
-
149
-
150
-
151
-
152
-
153
-
154
 |
 |
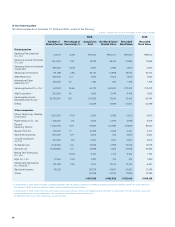
96
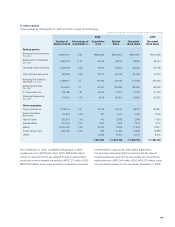
2006 2005
Assets Liabilities Sales Net income
(Loss)
Assets Liabilities Sales Net income
(Loss)
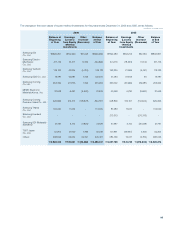
Samsung SDI
Co., Ltd. \6,399,632 \1,694,492 \4,907,618 \91,446 \5,729,771 \1,157,894 \5,718,899 \240,074
Samsung Electro-
Mechanics Co., Ltd. 3,061,143 1,275,989 2,393,645 96,896 2,774,120 1,098,202 2,231,204 (67,291)
Samsung Techwin
Co., Ltd. 1,776,634 925,667 2,868,706 160,262 1,624,359 912,420 2,391,351 86,444
Samsung SDS Co., Ltd. 1,272,924 560,871 2,100,034 220,863 953,142 472,665 1,875,222 147,796
Samsung Corning
Co, Ltd. 643,691 128,108 481,701 (47,868) 700,016 139,356 615,051 (144,706)
MEMC Electronic
Materials Korea, Inc. 224,300 36,104 207,830 28,500 220,465 32,218 204,984 33,908
Samsung Corning
Precision Glass Co., Ltd. 2,445,602 273,780 1,965,653 891,066 1,997,442 459,687 1,702,944 780,015
Samsung Thales
Co., Ltd. 447,303 215,061 461,872 22,525 348,684 138,967 452,665 27,265
Samsung SDI (Malaysia)
SDN BHD 177,821 51,853 330,726 19,370 202,169 74,008 408,531 39,541
TSST Japan Co., Ltd. 382,393 341,754 1,395,532 22,311 358,492 342,997 1,466,305 (92,964)
Others 1,248,948 380,706 1,235,190 70,357 998,364 342,055 1,173,974 49,659
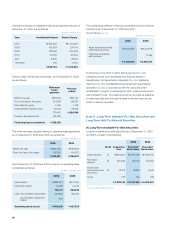
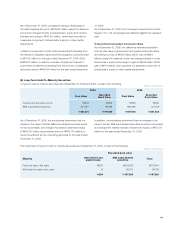
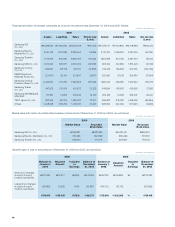
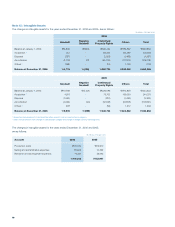
Market value information of publicly listed investee companies as of December 31, 2006 and 2005, are as follows:
2006 2005
Market Value Recorded
Book Value
Market Value Recorded
Book Value
Samsung SDI Co., Ltd. \596,881 \920,389 \1,081,441 \897,461
Samsung Electro- Mechanics Co., Ltd. 766,995 394,899 680,299 373,051
Samsung Techwin Co., Ltd. 665,564 216,118 353,857 179,044
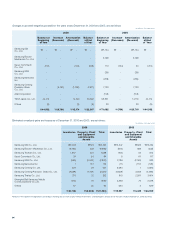
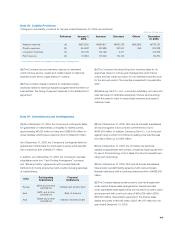
Valuation gain or loss on securities as of December 31, 2006 and 2005, are as follows:
2006 2005
Balance at
January 1,
2006
Valuation
Amount
Included
in
Earnings
Balance at
December
31, 2006
Balance at
January 1,
2005
Valuation
Amount
Included
in
Earnings
Balance at
December
31, 2005
Gains from changes
in equity of equity
method investments
\123,384 \18,877 \(303) \141,958 \197,320 \(73,936) \ - \123,384
Losses from changes
in equity of equity
method investments
(63,969) 20,562 (480) (43,887) (124,701) 60,732 - (63,969)
\59,415 \39,439 \(783) \98,071 \72,619 \(13,204) \ - \59,415
Financial information of investee companies as of and for the years ended December 31, 2006 and 2005, follows:
(In millions of Korean won)
(In millions of Korean won)
(In millions of Korean won)