Samsung 2006 Annual Report Download - page 140
Download and view the complete annual report
Please find page 140 of the 2006 Samsung annual report below. You can navigate through the pages in the report by either clicking on the pages listed below, or by using the keyword search tool below to find specific information within the annual report.-
 1
1 -
2
-
3
-
4
-
5
-
6
-
7
-
8
-
9
-
10
-
11
-
12
-
13
-
14
-
15
-
16
-
17
-
18
-
19
-
20
-
21
-
22
-
23
-
24
-
25
-
26
-
27
-
28
-
29
-
30
-
31
-
32
-
33
-
34
-
35
-
36
-
37
-
38
-
39
-
40
-
41
-
42
-
43
-
44
-
45
-
46
-
47
-
48
-
49
-
50
-
51
-
52
-
53
-
54
-
55
-
56
-
57
-
58
-
59
-
60
-
61
-
62
-
63
-
64
-
65
-
66
-
67
-
68
-
69
-
70
-
71
-
72
-
73
-
74
-
75
-
76
-
77
-
78
-
79
-
80
-
81
-
82
-
83
-
84
-
85
-
86
-
87
-
88
-
89
-
90
-
91
-
92
-
93
-
94
-
95
-
96
-
97
-
98
-
99
-
100
-
101
-
102
-
103
-
104
-
105
-
106
-
107
-
108
-
109
-
110
-
111
-
112
-
113
-
114
-
115
-
116
-
117
-
118
-
119
-
120
-
121
-
122
-
123
-
124
-
125
-
126
-
127
-
128
-
129
-
 130
130 -
 131
131 -
 132
132 -
 133
133 -
 134
134 -
 135
135 -
 136
136 -
 137
137 -
 138
138 -
 139
139 -
 140
140 -
 141
141 -
 142
142 -
 143
143 -
 144
144 -
 145
145 -
 146
146 -
 147
147 -
 148
148 -
 149
149 -
 150
150 -
151
-
152
-
153
-
154
 |
 |
130
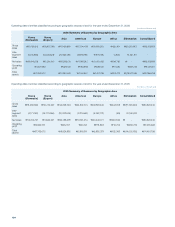
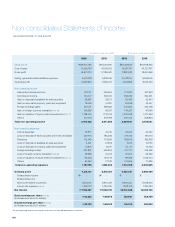
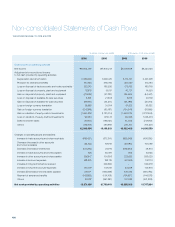
Non-consolidated Statements of Cash Flows
2006 2005 2006 2005
Cash flows from operating activities
Net income \7,926,087 \7,640,213 $8,531,848 $8,224,126
Adjustments to reconcile net income
to net cash provided by operating activities
Depreciation and amortization 5,680,609 5,060,475 6,114,757 5,447,228
Provision for severance benefits 447,360 385,706 481,550 415,184
Loss on disposal of trade accounts and notes receivable 253,740 185,536 273,132 199,716
Loss on disposal of property, plant and equipment 37,876 13,517 40,771 14,550
Gain on disposal of property, plant and equipment (78,636) (41,291) (84,646) (44,447)
Loss on disposal of available-for-sale securities 3,691 21,533 3,973 23,179
Gain on disposal of available-for-sale securities (58,980) (33,271) (63,488) (35,814)
Loss on foreign currency translation 28,988 31,244 31,203 33,632
Gain on foreign currency translation (124,989) (90,187) (134,541) (97,080)
Gain on valuation of equity-method investments (1,440,674) (1,131,014) (1,550,779) (1,217,453)
Loss on valuation of equity-method investments 92,553 972,173 99,626 1,046,473
Deferred income taxes (10,871) (198,751) (11,702) (213,941)
Others 232,900 290,968 250,701 313,206
12,989,654 13,106,851 13,982,405 14,108,559
Changes in operating assets and liabilities
Increase in trade accounts and notes receivable (616,437) (372,311) (663,549) (400,765)
Decrease (Increase) in other accounts
and notes receivable (25,162) 93,912 (27,085) 101,089
Decrease (Increase) in inventories (517,392) 24,910 (556,934) 26,814
Increase in trade accounts and notes payable 526 49,381 566 53,155
Increase in other accounts and notes payable 206,817 191,393 222,623 206,020
Increase in accrued expenses 428,275 183,115 461,006 197,110
Increase in long-term advance received - 505,950 - 544,618
Increase in long-term accrued expenses 140,779 133,748 151,538 143,970
Increase (Decrease) in income taxes payable 316,171 (600,859) 340,335 (646,780)
Payment of severance benefits (143,862) (134,308) (154,857) (144,573)
Others 94,787 (391,381) 102,032 (421,293)
Net cash provided by operating activities 12,874,156 12,790,401 13,858,080 13,767,924
Years Ended December 31, 2006 and 2005
(In millions of Korean won (note3)) (In thousands of U.S. dollars (note3))