Pottery Barn 2010 Annual Report Download - page 79
Download and view the complete annual report
Please find page 79 of the 2010 Pottery Barn annual report below. You can navigate through the pages in the report by either clicking on the pages listed below, or by using the keyword search tool below to find specific information within the annual report.-
 1
1 -
2
-
3
-
4
-
5
-
6
-
7
-
8
-
9
-
10
-
11
-
12
-
13
-
14
-
15
-
16
-
17
-
18
-
19
-
20
-
21
-
22
-
23
-
24
-
25
-
26
-
27
-
28
-
29
-
30
-
31
-
32
-
33
-
34
-
35
-
36
-
37
-
38
-
39
-
40
-
41
-
42
-
43
-
44
-
45
-
46
-
47
-
48
-
49
-
50
-
51
-
52
-
53
-
54
-
55
-
56
-
57
-
58
-
59
-
60
-
61
-
62
-
63
-
64
-
65
-
66
-
67
-
68
-
 69
69 -
 70
70 -
 71
71 -
 72
72 -
 73
73 -
 74
74 -
 75
75 -
 76
76 -
 77
77 -
 78
78 -
 79
79 -
 80
80 -
 81
81 -
 82
82 -
 83
83 -
 84
84 -
 85
85 -
 86
86 -
 87
87 -
 88
88 -
 89
89 -
90
-
91
-
92
-
93
-
94
-
95
-
96
-
97
-
98
-
99
-
100
-
101
-
102
-
103
-
104
-
105
-
106
-
107
-
108
-
109
-
110
-
111
-
112
-
113
-
114
-
115
-
116
-
117
-
118
-
119
-
120
-
121
-
122
-
123
-
124
-
125
-
126
-
127
-
128
-
129
-
130
-
131
-
132
-
133
-
134
-
135
-
136
-
137
-
138
-
139
-
140
-
141
-
142
-
143
-
144
-
145
-
146
-
147
-
148
-
149
-
150
-
151
-
152
-
153
-
154
-
155
-
156
-
157
-
158
-
159
-
160
-
161
-
162
-
163
-
164
-
165
-
166
-
167
-
168
-
169
-
170
-
171
-
172
-
173
-
174
-
175
-
176
-
177
-
178
-
179
-
180
-
181
-
182
-
183
-
184
-
185
-
186
-
187
-
188
-
189
-
190
-
191
-
192
-
193
-
194
-
195
-
196
-
197
-
198
-
199
-
200
-
201
-
202
-
203
-
204
-
205
-
206
-
207
-
208
-
209
-
210
-
211
-
212
-
213
-
214
-
215
-
216
-
217
-
218
-
219
-
220
-
221
-
222
-
223
-
224
-
225
-
226
-
227
-
228
-
229
-
230
-
231
-
232
-
233
-
234
-
235
-
236
-
237
-
238
-
239
-
240
-
241
-
242
-
243
-
244
-
245
-
246
-
247
-
248
-
249
-
250
-
251
-
252
 |
 |

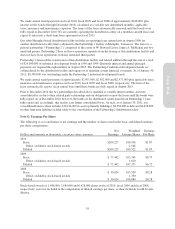
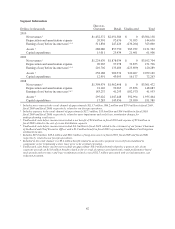
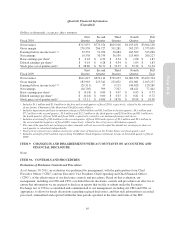
Quarterly Financial Information
(Unaudited)
Dollars in thousands, except per share amounts
Fiscal 2010
First
Quarter
Second
Quarter
Third
Quarter
Fourth
Quarter
Full
Year
Net revenues $717,637 $775,554 $815,516 $1,195,451 $3,504,158
Gross margin 270,558 286,727 311,281 505,293 1,373,859
Earnings before income taxes1,2,3 32,333 51,074 56,084 183,569 323,060
Net earnings 19,538 30,759 36,530 113,400 200,227
Basic earnings per share4$ 0.18 $ 0.29 $ 0.34 $ 1.08 $ 1.87
Diluted earnings per share4$ 0.18 $ 0.28 $ 0.34 $ 1.05 $ 1.83
Stock price (as of quarter-end) 5$ 28.80 $ 26.71 $ 32.37 $ 32.34 $ 32.34
Fiscal 2009
First
Quarter
Second
Quarter
Third
Quarter
Fourth
Quarter
Full
Year
Net revenues $611,615 $672,114 $729,297 $1,089,678 $3,102,704
Gross margin 183,963 215,341 252,852 451,081 1,103,237
Earnings before income taxes2,3,6 (29,511) 57 9,115 140,628 120,289
Net earnings (18,705) 399 7,327 88,421 77,442
Basic earnings per share4$ (0.18) $ 0.00 $ 0.07 $ 0.83 $ 0.73
Diluted earnings per share4$ (0.18) $ 0.00 $ 0.07 $ 0.81 $ 0.72
Stock price (as of quarter-end) 5$ 13.11 $ 14.06 $ 18.78 $ 18.98 $ 18.98
1Includes $3.3 million and $1.0 million in the first and second quarter of fiscal 2010, respectively, related to the retirement
of our former Chairman of the Board and Chief Executive Officer.
2Includes impairment and lease termination charges of $6.0 million and $6.1 million in the first quarter, $4.3 million and
$7.2 million in the second quarter, $3.4 million and $12.2 million in the third quarter and $3.8 million and $9.5 million in
the fourth quarter of fiscal 2010 and fiscal 2009, respectively, related to our underperforming retail stores.
3Includes a net benefit of $0.4 million in the second quarter of fiscal 2010 and expense of $1.3 million and $6.3 million in
the second and third quarters of fiscal 2009, respectively, related to the exit of excess distribution capacity.
4The sum of the quarterly net earnings per share amounts will not necessarily equal the annual net earnings per share as
each quarter is calculated independently.
5Stock prices represent our common stock price at the close of business on the Friday before our fiscal quarter-end.
6Includes a benefit of $1.9 million representing Visa/MasterCard litigation settlement income in the fourth quarter of fiscal
2009.
ITEM 9. CHANGES IN AND DISAGREEMENTS WITH ACCOUNTANTS ON ACCOUNTING AND
FINANCIAL DISCLOSURE
None.
ITEM 9A. CONTROLS AND PROCEDURES
Evaluation of Disclosure Controls and Procedures
As of January 30, 2011, an evaluation was performed by management, with the participation of our Chief
Executive Officer (“CEO”) and our Executive Vice President, Chief Operating and Chief Financial Officer
(“CFO”), of the effectiveness of our disclosure controls and procedures. Based on that evaluation, our
management, including our CEO and CFO, concluded that our disclosure controls and procedures are effective to
ensure that information we are required to disclose in reports that we file or submit under the Securities
Exchange Act of 1934 is accumulated and communicated to our management, including our CEO and CFO, as
appropriate, to allow for timely discussions regarding required disclosures, and that such information is recorded,
processed, summarized and reported within the time periods specified in the rules and forms of the SEC.
65
Form 10-K