Pottery Barn 2010 Annual Report Download - page 43
Download and view the complete annual report
Please find page 43 of the 2010 Pottery Barn annual report below. You can navigate through the pages in the report by either clicking on the pages listed below, or by using the keyword search tool below to find specific information within the annual report.-
 1
1 -
2
-
3
-
4
-
5
-
6
-
7
-
8
-
9
-
10
-
11
-
12
-
13
-
14
-
15
-
16
-
17
-
18
-
19
-
20
-
21
-
22
-
23
-
24
-
25
-
26
-
27
-
28
-
29
-
30
-
31
-
32
-
 33
33 -
 34
34 -
 35
35 -
 36
36 -
 37
37 -
 38
38 -
 39
39 -
 40
40 -
 41
41 -
 42
42 -
 43
43 -
 44
44 -
 45
45 -
 46
46 -
 47
47 -
 48
48 -
 49
49 -
 50
50 -
 51
51 -
 52
52 -
 53
53 -
54
-
55
-
56
-
57
-
58
-
59
-
60
-
61
-
62
-
63
-
64
-
65
-
66
-
67
-
68
-
69
-
70
-
71
-
72
-
73
-
74
-
75
-
76
-
77
-
78
-
79
-
80
-
81
-
82
-
83
-
84
-
85
-
86
-
87
-
88
-
89
-
90
-
91
-
92
-
93
-
94
-
95
-
96
-
97
-
98
-
99
-
100
-
101
-
102
-
103
-
104
-
105
-
106
-
107
-
108
-
109
-
110
-
111
-
112
-
113
-
114
-
115
-
116
-
117
-
118
-
119
-
120
-
121
-
122
-
123
-
124
-
125
-
126
-
127
-
128
-
129
-
130
-
131
-
132
-
133
-
134
-
135
-
136
-
137
-
138
-
139
-
140
-
141
-
142
-
143
-
144
-
145
-
146
-
147
-
148
-
149
-
150
-
151
-
152
-
153
-
154
-
155
-
156
-
157
-
158
-
159
-
160
-
161
-
162
-
163
-
164
-
165
-
166
-
167
-
168
-
169
-
170
-
171
-
172
-
173
-
174
-
175
-
176
-
177
-
178
-
179
-
180
-
181
-
182
-
183
-
184
-
185
-
186
-
187
-
188
-
189
-
190
-
191
-
192
-
193
-
194
-
195
-
196
-
197
-
198
-
199
-
200
-
201
-
202
-
203
-
204
-
205
-
206
-
207
-
208
-
209
-
210
-
211
-
212
-
213
-
214
-
215
-
216
-
217
-
218
-
219
-
220
-
221
-
222
-
223
-
224
-
225
-
226
-
227
-
228
-
229
-
230
-
231
-
232
-
233
-
234
-
235
-
236
-
237
-
238
-
239
-
240
-
241
-
242
-
243
-
244
-
245
-
246
-
247
-
248
-
249
-
250
-
251
-
252
 |
 |

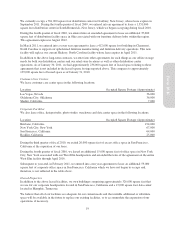
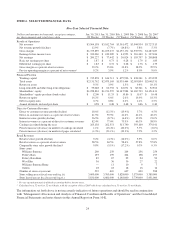
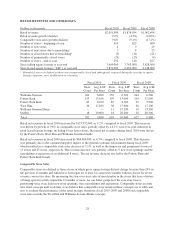
Percentages represent changes in comparable store sales versus the same period in the prior year.
Growth (decline) in comparable store sales Fiscal 2010 Fiscal 2009 Fiscal 2008
Williams-Sonoma 4.6% (2.7%) (11.4%)
Pottery Barn 14.3% (4.4%) (21.8%)
Pottery Barn Kids 13.0% (9.5%) (17.8%)
Outlets 8.0% (14.8%) (17.1%)
Total 9.8% (5.1%) (17.2%)
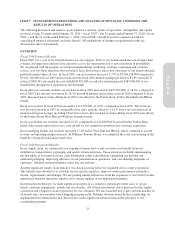
Various factors affect comparable store sales, including the overall economic and general retail sales
environment as well as current local and global economic conditions, each of which were significant factors in
our comparable store sales results for fiscal 2010. Additional factors have affected our comparable store sales
results in the past and may continue to affect them in the future, such as the number, size and location of stores
we open, close, remodel or expand in any period, consumer preferences and buying trends, changes in sales mix
among distribution channels, our ability to efficiently source and distribute products, changes in our merchandise
mix, competition (including competitive promotional activity and discount retailers), the timing of our releases of
new merchandise and promotional events, the success of marketing programs, the cannibalization of existing
store sales by our new stores, the benefits of closing underperforming stores in multi-store markets, changes in
catalog circulation and in our direct-to-customer business and fluctuations in foreign exchange rates. Among
other things, weather conditions can affect comparable store sales because inclement weather can alter consumer
behavior or require us to close certain stores temporarily and thus reduce store traffic. Even if stores are not
closed, many customers may decide to avoid going to stores in bad weather. These factors have caused our
comparable store sales to fluctuate significantly in the past on an annual, quarterly and monthly basis and, as a
result, we expect that comparable store sales will continue to fluctuate in the future.
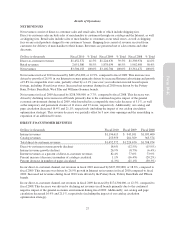
COST OF GOODS SOLD
Dollars in thousands Fiscal 2010
% Net
Revenues Fiscal 2009
% Net
Revenues Fiscal 2008
% Net
Revenues
Total cost of goods sold1$2,130,299 60.8% $1,999,467 64.4% $2,226,300 66.2%
1Includes total occupancy expenses of $506,712,000, $519,224,000 and $536,181,000 in fiscal 2010, fiscal 2009 and fiscal
2008, respectively.
Cost of goods sold includes cost of goods, occupancy expenses and shipping costs. Cost of goods consists of cost
of merchandise, inbound freight expenses, freight-to-store expenses and other inventory related costs such as
shrinkage, damages and replacements. Occupancy expenses consist of rent, depreciation and other occupancy
costs, including common area maintenance and utilities. Shipping costs consist of third party delivery services
and shipping materials.
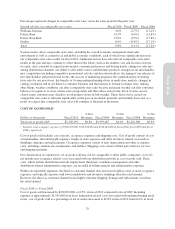
Our classification of expenses in cost of goods sold may not be comparable to other public companies, as we do
not include non-occupancy related costs associated with our distribution network in cost of goods sold. These
costs, which include distribution network employment, third party warehouse management and other
distribution-related administrative expenses, are recorded in selling, general and administrative expenses.
Within our reportable segments, the direct-to-customer channel does not incur freight-to-store or store occupancy
expenses, and typically operates with lower markdowns and inventory shrinkage than the retail channel.
However, the direct-to-customer channel incurs higher customer shipping, damage and replacement costs than
the retail channel.
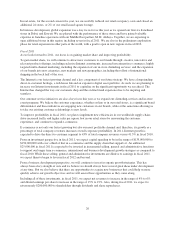
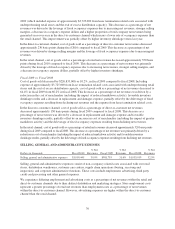
Fiscal 2010 vs. Fiscal 2009
Cost of goods sold increased by $130,832,000, or 6.5%, in fiscal 2010 compared to fiscal 2009. Including
expense of approximately $1,141,000 from lease termination related costs associated with underperforming retail
stores, cost of goods sold as a percentage of net revenues decreased to 60.8% in fiscal 2010 from 64.4% in fiscal
29
Form 10-K