Pottery Barn 2010 Annual Report Download - page 76
Download and view the complete annual report
Please find page 76 of the 2010 Pottery Barn annual report below. You can navigate through the pages in the report by either clicking on the pages listed below, or by using the keyword search tool below to find specific information within the annual report.-
 1
1 -
2
-
3
-
4
-
5
-
6
-
7
-
8
-
9
-
10
-
11
-
12
-
13
-
14
-
15
-
16
-
17
-
18
-
19
-
20
-
21
-
22
-
23
-
24
-
25
-
26
-
27
-
28
-
29
-
30
-
31
-
32
-
33
-
34
-
35
-
36
-
37
-
38
-
39
-
40
-
41
-
42
-
43
-
44
-
45
-
46
-
47
-
48
-
49
-
50
-
51
-
52
-
53
-
54
-
55
-
56
-
57
-
58
-
59
-
60
-
61
-
62
-
63
-
64
-
65
-
 66
66 -
 67
67 -
 68
68 -
 69
69 -
 70
70 -
 71
71 -
 72
72 -
 73
73 -
 74
74 -
 75
75 -
 76
76 -
 77
77 -
 78
78 -
 79
79 -
 80
80 -
 81
81 -
 82
82 -
 83
83 -
 84
84 -
 85
85 -
 86
86 -
87
-
88
-
89
-
90
-
91
-
92
-
93
-
94
-
95
-
96
-
97
-
98
-
99
-
100
-
101
-
102
-
103
-
104
-
105
-
106
-
107
-
108
-
109
-
110
-
111
-
112
-
113
-
114
-
115
-
116
-
117
-
118
-
119
-
120
-
121
-
122
-
123
-
124
-
125
-
126
-
127
-
128
-
129
-
130
-
131
-
132
-
133
-
134
-
135
-
136
-
137
-
138
-
139
-
140
-
141
-
142
-
143
-
144
-
145
-
146
-
147
-
148
-
149
-
150
-
151
-
152
-
153
-
154
-
155
-
156
-
157
-
158
-
159
-
160
-
161
-
162
-
163
-
164
-
165
-
166
-
167
-
168
-
169
-
170
-
171
-
172
-
173
-
174
-
175
-
176
-
177
-
178
-
179
-
180
-
181
-
182
-
183
-
184
-
185
-
186
-
187
-
188
-
189
-
190
-
191
-
192
-
193
-
194
-
195
-
196
-
197
-
198
-
199
-
200
-
201
-
202
-
203
-
204
-
205
-
206
-
207
-
208
-
209
-
210
-
211
-
212
-
213
-
214
-
215
-
216
-
217
-
218
-
219
-
220
-
221
-
222
-
223
-
224
-
225
-
226
-
227
-
228
-
229
-
230
-
231
-
232
-
233
-
234
-
235
-
236
-
237
-
238
-
239
-
240
-
241
-
242
-
243
-
244
-
245
-
246
-
247
-
248
-
249
-
250
-
251
-
252
 |
 |

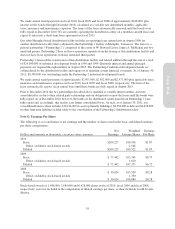
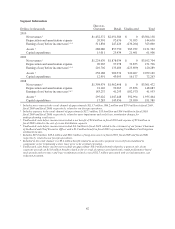
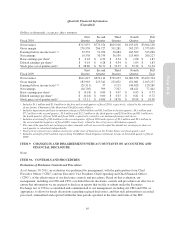
Segment Information
Dollars in thousands
Direct-to-
Customer Retail Unallocated Total
2010
Net revenues1$1,452,572 $2,051,586 $ 0 $3,504,158
Depreciation and amortization expense 20,901 92,676 31,053 144,630
Earnings (loss) before income taxes2,3,4 311,838 247,426 (236,204) 323,060
Assets 5288,080 857,750 985,932 2,131,762
Capital expenditures 15,011 25,434 21,461 61,906
2009
Net revenues1$1,224,670 $1,878,034 $ 0 $3,102,704
Depreciation and amortization expense 20,965 97,978 32,853 151,796
Earnings (loss) before income taxes2,3,4 210,702 133,486 (223,899) 120,289
Assets 5258,188 900,574 920,407 2,079,169
Capital expenditures 12,991 43,095 16,177 72,263
2008
Net revenues1$1,398,974 $1,962,498 $ 0 $3,361,472
Depreciation and amortization expense 21,142 99,065 27,876 148,083
Earnings (loss) before income taxes2,6,7 183,237 41,293 (182,577) 41,953
Assets 5295,022 1,047,448 592,994 1,935,464
Capital expenditures 17,283 145,456 29,050 191,789
1Includes net revenues in the retail channel of approximately $113.7 million, $84.2 million and $79.9 million in fiscal 2010,
fiscal 2009 and fiscal 2008, respectively, related to our foreign operations.
2Includes expenses in the retail channel of approximately $17.5 million, $35.0 million and $34.0 million in fiscal 2010,
fiscal 2009 and fiscal 2008, respectively, related to asset impairment and early lease termination charges for
underperforming retail stores.
3Unallocated costs before income taxes include a net benefit of $0.4 million in fiscal 2010 and expense of $7.6 million in
fiscal 2009 related to the exit of excess distribution capacity.
4Unallocated costs before income taxes include $4.3 million in fiscal 2010 related to the retirement of our former Chairman
of the Board and Chief Executive Officer and a $1.9 million benefit in fiscal 2009 representing Visa/MasterCard litigation
settlement income.
5Includes $27.0 million, $29.6 million and $28.3 million of long-term assets in fiscal 2010, fiscal 2009 and fiscal 2008,
respectively, related to our foreign operations.
6Included in the retail channel is a $9.4 million benefit related to an incentive payment received from a landlord to
compensate us for terminating a store lease prior to its original expiration.
7Unallocated costs before income taxes include an approximate $16.0 million benefit related to a gain on sale of our
corporate aircraft, an $11.0 million benefit related to the reversal of expense associated with certain performance-based
stock awards and severance and lease termination related costs of $12.7 million associated with our infrastructure cost
reduction program.
62