Pottery Barn 2010 Annual Report Download - page 44
Download and view the complete annual report
Please find page 44 of the 2010 Pottery Barn annual report below. You can navigate through the pages in the report by either clicking on the pages listed below, or by using the keyword search tool below to find specific information within the annual report.-
 1
1 -
2
-
3
-
4
-
5
-
6
-
7
-
8
-
9
-
10
-
11
-
12
-
13
-
14
-
15
-
16
-
17
-
18
-
19
-
20
-
21
-
22
-
23
-
24
-
25
-
26
-
27
-
28
-
29
-
30
-
31
-
32
-
33
-
 34
34 -
 35
35 -
 36
36 -
 37
37 -
 38
38 -
 39
39 -
 40
40 -
 41
41 -
 42
42 -
 43
43 -
 44
44 -
 45
45 -
 46
46 -
 47
47 -
 48
48 -
 49
49 -
 50
50 -
 51
51 -
 52
52 -
 53
53 -
 54
54 -
55
-
56
-
57
-
58
-
59
-
60
-
61
-
62
-
63
-
64
-
65
-
66
-
67
-
68
-
69
-
70
-
71
-
72
-
73
-
74
-
75
-
76
-
77
-
78
-
79
-
80
-
81
-
82
-
83
-
84
-
85
-
86
-
87
-
88
-
89
-
90
-
91
-
92
-
93
-
94
-
95
-
96
-
97
-
98
-
99
-
100
-
101
-
102
-
103
-
104
-
105
-
106
-
107
-
108
-
109
-
110
-
111
-
112
-
113
-
114
-
115
-
116
-
117
-
118
-
119
-
120
-
121
-
122
-
123
-
124
-
125
-
126
-
127
-
128
-
129
-
130
-
131
-
132
-
133
-
134
-
135
-
136
-
137
-
138
-
139
-
140
-
141
-
142
-
143
-
144
-
145
-
146
-
147
-
148
-
149
-
150
-
151
-
152
-
153
-
154
-
155
-
156
-
157
-
158
-
159
-
160
-
161
-
162
-
163
-
164
-
165
-
166
-
167
-
168
-
169
-
170
-
171
-
172
-
173
-
174
-
175
-
176
-
177
-
178
-
179
-
180
-
181
-
182
-
183
-
184
-
185
-
186
-
187
-
188
-
189
-
190
-
191
-
192
-
193
-
194
-
195
-
196
-
197
-
198
-
199
-
200
-
201
-
202
-
203
-
204
-
205
-
206
-
207
-
208
-
209
-
210
-
211
-
212
-
213
-
214
-
215
-
216
-
217
-
218
-
219
-
220
-
221
-
222
-
223
-
224
-
225
-
226
-
227
-
228
-
229
-
230
-
231
-
232
-
233
-
234
-
235
-
236
-
237
-
238
-
239
-
240
-
241
-
242
-
243
-
244
-
245
-
246
-
247
-
248
-
249
-
250
-
251
-
252
 |
 |

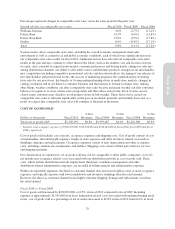
2009 (which included expense of approximately $3,725,000 from lease termination related costs associated with
underperforming retail stores and the exit of excess distribution capacity). This decrease as a percentage of net
revenues was driven by the leverage of fixed occupancy expenses due to increasing net revenues, stronger selling
margins, a decrease in occupancy expense dollars and a higher proportion of total company net revenues being
generated year-over-year in the direct-to-customer channel which incurs a lower rate of occupancy expenses than
the retail channel. This improvement was partially offset by higher inventory shrinkage versus last year.
In the direct-to-customer channel, cost of goods sold as a percentage of direct-to-customer net revenues decreased
approximately 230 basis points during fiscal 2010 compared to fiscal 2009. This decrease as a percentage of net
revenues was driven by stronger selling margins and the leverage of fixed occupancy expenses due to increasing net
revenues.
In the retail channel, cost of goods sold as a percentage of retail net revenues decreased approximately 350 basis
points during fiscal 2010 compared to fiscal 2009. This decrease as a percentage of net revenues was primarily
driven by the leverage of fixed occupancy expenses due to increasing net revenues, stronger selling margins, and
a decrease in occupancy expense dollars, partially offset by higher inventory shrinkage.
Fiscal 2009 vs. Fiscal 2008
Cost of goods sold decreased by $226,833,000, or 10.2%, in fiscal 2009 compared to fiscal 2008. Including
expense of approximately $3,725,000 from lease termination related costs associated with underperforming retail
stores and the exit of excess distribution capacity, cost of goods sold as a percentage of net revenues decreased to
64.4% in fiscal 2009 from 66.2% in fiscal 2008. This decrease as a percentage of net revenues was driven by a
reduction in the cost of merchandise (including the impact of reduced markdown activity), favorable inventory
shrinkage results and a decrease in replacement and damages expense, partially offset by the deleverage of fixed
occupancy expenses resulting from declining net revenues and the expense from lease termination related costs.
In the direct-to-customer channel, cost of goods sold as a percentage of direct-to-customer net revenues
decreased approximately 130 basis points during fiscal 2009 compared to fiscal 2008. This decrease as a
percentage of net revenues was driven by a decrease in replacement and damages expense and favorable
inventory shrinkage results, partially offset by an increase in cost of merchandise (including the impact of greater
markdown activity) and the deleverage of fixed occupancy expenses resulting from declining net revenues.
In the retail channel, cost of goods sold as a percentage of retail net revenues decreased approximately 320 basis points
during fiscal 2009 compared to fiscal 2008. This decrease as a percentage of net revenues was primarily driven by a
reduction in cost of merchandise (including the impact of reduced markdown activity) and favorable inventory
shrinkage results, partially offset by the deleverage of fixed occupancy expenses resulting from declining net revenues.
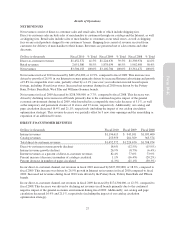
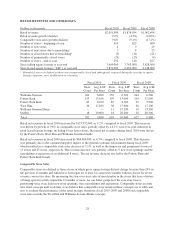
SELLING, GENERAL AND ADMINISTRATIVE EXPENSES
Dollars in thousands Fiscal 2010
% Net
Revenues Fiscal 2009
% Net
Revenues Fiscal 2008
% Net
Revenues
Selling, general and administrative expenses $1,050,445 30.0% $981,795 31.6% $1,093,019 32.5%
Selling, general and administrative expenses consist of non-occupancy related costs associated with our retail
stores, distribution warehouses, customer care centers, supply chain operations (buying, receiving and
inspection), and corporate administrative functions. These costs include employment, advertising, third party
credit card processing and other general expenses.
We experience differing employment and advertising costs as a percentage of net revenues within the retail and
direct-to-customer channels due to their distinct distribution and marketing strategies. Store employment costs
represent a greater percentage of retail net revenues than employment costs as a percentage of net revenues
within the direct-to-customer channel. However, advertising expenses are higher within the direct-to-customer
channel than the retail channel.
30