Pottery Barn 2010 Annual Report Download - page 68
Download and view the complete annual report
Please find page 68 of the 2010 Pottery Barn annual report below. You can navigate through the pages in the report by either clicking on the pages listed below, or by using the keyword search tool below to find specific information within the annual report.-
 1
1 -
2
-
3
-
4
-
5
-
6
-
7
-
8
-
9
-
10
-
11
-
12
-
13
-
14
-
15
-
16
-
17
-
18
-
19
-
20
-
21
-
22
-
23
-
24
-
25
-
26
-
27
-
28
-
29
-
30
-
31
-
32
-
33
-
34
-
35
-
36
-
37
-
38
-
39
-
40
-
41
-
42
-
43
-
44
-
45
-
46
-
47
-
48
-
49
-
50
-
51
-
52
-
53
-
54
-
55
-
56
-
57
-
 58
58 -
 59
59 -
 60
60 -
 61
61 -
 62
62 -
 63
63 -
 64
64 -
 65
65 -
 66
66 -
 67
67 -
 68
68 -
 69
69 -
 70
70 -
 71
71 -
 72
72 -
 73
73 -
 74
74 -
 75
75 -
 76
76 -
 77
77 -
 78
78 -
79
-
80
-
81
-
82
-
83
-
84
-
85
-
86
-
87
-
88
-
89
-
90
-
91
-
92
-
93
-
94
-
95
-
96
-
97
-
98
-
99
-
100
-
101
-
102
-
103
-
104
-
105
-
106
-
107
-
108
-
109
-
110
-
111
-
112
-
113
-
114
-
115
-
116
-
117
-
118
-
119
-
120
-
121
-
122
-
123
-
124
-
125
-
126
-
127
-
128
-
129
-
130
-
131
-
132
-
133
-
134
-
135
-
136
-
137
-
138
-
139
-
140
-
141
-
142
-
143
-
144
-
145
-
146
-
147
-
148
-
149
-
150
-
151
-
152
-
153
-
154
-
155
-
156
-
157
-
158
-
159
-
160
-
161
-
162
-
163
-
164
-
165
-
166
-
167
-
168
-
169
-
170
-
171
-
172
-
173
-
174
-
175
-
176
-
177
-
178
-
179
-
180
-
181
-
182
-
183
-
184
-
185
-
186
-
187
-
188
-
189
-
190
-
191
-
192
-
193
-
194
-
195
-
196
-
197
-
198
-
199
-
200
-
201
-
202
-
203
-
204
-
205
-
206
-
207
-
208
-
209
-
210
-
211
-
212
-
213
-
214
-
215
-
216
-
217
-
218
-
219
-
220
-
221
-
222
-
223
-
224
-
225
-
226
-
227
-
228
-
229
-
230
-
231
-
232
-
233
-
234
-
235
-
236
-
237
-
238
-
239
-
240
-
241
-
242
-
243
-
244
-
245
-
246
-
247
-
248
-
249
-
250
-
251
-
252
 |
 |

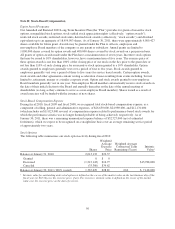
20 years. The rental payment requirements in our store leases are typically structured as either minimum rent,
minimum rent plus additional rent based on a percentage of store sales if a specified store sales threshold is
exceeded, or rent based on a percentage of store sales if a specified store sales threshold or contractual
obligations of the landlord has not been met. Contingent rental payments, including rental payments that are
based on a percentage of sales, cannot be predicted with certainty at the onset of the lease term. Accordingly, any
contingent rental payments are recorded as incurred each period when the sales threshold is probable of being
met and are excluded from our calculation of deferred rent liability.
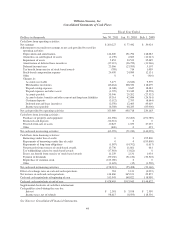
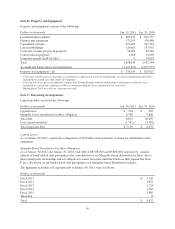
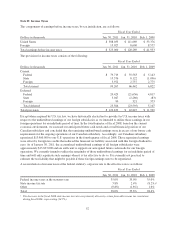
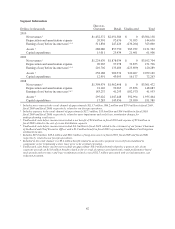
Total rental expense for all operating leases was as follows:
Fiscal Year Ended
Dollars in thousands Jan. 30, 2011 Jan. 31, 2010 Feb. 1, 2009
Rent expense $185,979 $189,404 $192,579
Contingent rent expense 34,856 33,994 32,268
Rent expense before deferred lease incentive income 220,835 223,398 224,847
Deferred lease incentive income (37,115) (36,799) (31,325)
Less: sublease rental income (329) (326) (175)
Total rent expense1$183,391 $186,273 $193,347
1Excludes all other occupancy-related costs including depreciation, common area maintenance, utilities and property taxes.
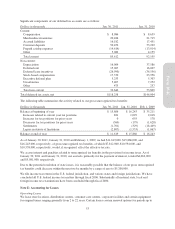
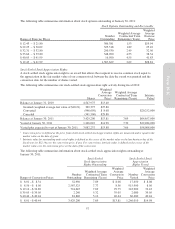
The aggregate future minimum annual cash rental payments under non-cancelable operating leases (excluding
the Memphis-based distribution facilities) in effect at January 30, 2011 were as follows:
Dollars in thousands Lease Commitments1,2
Fiscal 2011 $ 225,180
Fiscal 2012 205,825
Fiscal 2013 187,144
Fiscal 2014 166,367
Fiscal 2015 142,640
Thereafter 566,341
Total $1,493,497
1Represents future projected cash payments and, therefore, is not necessarily representative of future expected rental
expense.
2Projected cash payments include only those amounts that are fixed and determinable as of the reporting date. We currently
pay rent for certain store locations based on a percentage of store sales if a specified store sales threshold is or is not met
or if contractual obligations of the landlord have not been met. Projected payments for these locations are based on
minimum rent, which is generally higher than rent based on a percentage of store sales, as future store sales cannot be
predicted with certainty. In addition, projected cash payments do not include any benefit from deferred lease incentive
income, which is reflected within “Total rent expense” above.
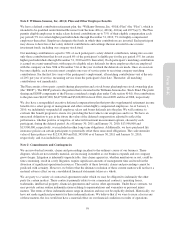
Note F: Memphis-Based Distribution Facilities
Our Memphis-based distribution facilities include an operating lease entered into in July 1983 for a distribution
facility in Memphis, Tennessee. The lessor is a general partnership (“Partnership 1”) comprised of the estate of
W. Howard Lester, our former Chairman of the Board of Directors and Chief Executive Officer, and James A.
McMahan, a Director Emeritus and a significant shareholder. Partnership 1 does not have operations separate
from the leasing of this distribution facility and does not have lease agreements with any unrelated third parties.
Partnership 1 financed the construction of this distribution facility through the sale of a total of $9,200,000 of
industrial development bonds in 1983 and 1985. As of January 30, 2011, the bonds had been repaid in full and no
amounts were outstanding.
54