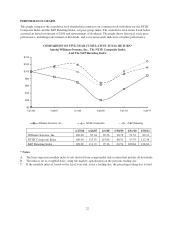
Pottery Barn 2010 Annual Report Download - page 42
Download and view the complete annual report
Please find page 42 of the 2010 Pottery Barn annual report below. You can navigate through the pages in the report by either clicking on the pages listed below, or by using the keyword search tool below to find specific information within the annual report.-
 1
1 -
2
-
3
-
4
-
5
-
6
-
7
-
8
-
9
-
10
-
11
-
12
-
13
-
14
-
15
-
16
-
17
-
18
-
19
-
20
-
21
-
22
-
23
-
24
-
25
-
26
-
27
-
28
-
29
-
30
-
31
-
 32
32 -
 33
33 -
 34
34 -
 35
35 -
 36
36 -
 37
37 -
 38
38 -
 39
39 -
 40
40 -
 41
41 -
 42
42 -
 43
43 -
 44
44 -
 45
45 -
 46
46 -
 47
47 -
 48
48 -
 49
49 -
 50
50 -
 51
51 -
 52
52 -
53
-
54
-
55
-
56
-
57
-
58
-
59
-
60
-
61
-
62
-
63
-
64
-
65
-
66
-
67
-
68
-
69
-
70
-
71
-
72
-
73
-
74
-
75
-
76
-
77
-
78
-
79
-
80
-
81
-
82
-
83
-
84
-
85
-
86
-
87
-
88
-
89
-
90
-
91
-
92
-
93
-
94
-
95
-
96
-
97
-
98
-
99
-
100
-
101
-
102
-
103
-
104
-
105
-
106
-
107
-
108
-
109
-
110
-
111
-
112
-
113
-
114
-
115
-
116
-
117
-
118
-
119
-
120
-
121
-
122
-
123
-
124
-
125
-
126
-
127
-
128
-
129
-
130
-
131
-
132
-
133
-
134
-
135
-
136
-
137
-
138
-
139
-
140
-
141
-
142
-
143
-
144
-
145
-
146
-
147
-
148
-
149
-
150
-
151
-
152
-
153
-
154
-
155
-
156
-
157
-
158
-
159
-
160
-
161
-
162
-
163
-
164
-
165
-
166
-
167
-
168
-
169
-
170
-
171
-
172
-
173
-
174
-
175
-
176
-
177
-
178
-
179
-
180
-
181
-
182
-
183
-
184
-
185
-
186
-
187
-
188
-
189
-
190
-
191
-
192
-
193
-
194
-
195
-
196
-
197
-
198
-
199
-
200
-
201
-
202
-
203
-
204
-
205
-
206
-
207
-
208
-
209
-
210
-
211
-
212
-
213
-
214
-
215
-
216
-
217
-
218
-
219
-
220
-
221
-
222
-
223
-
224
-
225
-
226
-
227
-
228
-
229
-
230
-
231
-
232
-
233
-
234
-
235
-
236
-
237
-
238
-
239
-
240
-
241
-
242
-
243
-
244
-
245
-
246
-
247
-
248
-
249
-
250
-
251
-
252
 |
 |

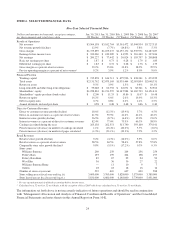
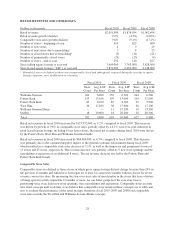
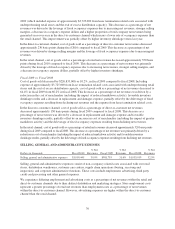
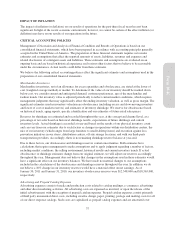
RETAIL REVENUES AND OTHER DATA
Dollars in thousands Fiscal 2010 Fiscal 2009 Fiscal 2008
Retail revenues $2,051,586 $1,878,034 $1,962,498
Retail revenue growth (decline) 9.2% (4.3%) (14.0%)
Comparable store sales growth (decline) 9.8% (5.1%) (17.2%)
Number of stores – beginning of year 610 627 600
Number of new stores 4 9 29
Number of new stores due to remodeling17823
Number of closed stores due to remodeling1(5) (11) (21)
Number of permanently closed stores (24) (23) (4)
Number of stores – end of year 592 610 627
Store selling square footage at year-end 3,609,000 3,763,000 3,828,000
Store leased square footage (“LSF”) at year-end 5,831,000 6,081,000 6,148,000
1Remodeled stores are defined as those stores temporarily closed and subsequently reopened during the year due to square
footage expansion, store modification or relocation.
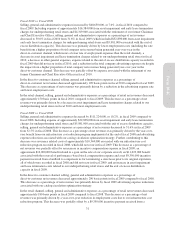
Fiscal 2010 Fiscal 2009 Fiscal 2008
Store
Count
Avg. LSF
Per Store
Store
Count
Avg. LSF
Per Store
Store
Count
Avg. LSF
Per Store
Williams-Sonoma 260 6,400 259 6,300 264 6,300
Pottery Barn 193 13,100 199 13,000 204 12,900
Pottery Barn Kids 85 8,100 87 8,100 95 7,900
West Elm 36 17,100 36 17,600 36 17,100
Williams-Sonoma Home — — 11 13,200 10 13,300
Outlets 18 19,600 18 20,200 18 20,300
Total 592 9,800 610 10,000 627 9,800
Retail net revenues in fiscal 2010 increased by $173,552,000, or 9.2%, compared to fiscal 2009. This increase
was driven by growth of 9.8% in comparable store sales, partially offset by a 4.1% year-over-year reduction in
retail leased square footage, including 18 net fewer stores. Increased net revenues during fiscal 2010 were driven
by the Pottery Barn, West Elm and Williams-Sonoma brands.
Retail net revenues in fiscal 2009 decreased by $84,464,000, or 4.3%, compared to fiscal 2008. This decrease
was primarily due to the continued negative impact of the general economic environment during fiscal 2009,
which resulted in a comparable store sales decrease of 5.1%, as well as the temporary and permanent closure of
11 stores and 23 stores, respectively. This revenue decrease was partially offset by 9 new store openings and the
remodeling or expansion of an additional 8 stores. The net revenue decrease was led by the Pottery Barn and
Pottery Barn Kids brands.
Comparable Store Sales
Comparable stores are defined as those stores in which gross square footage did not change by more than 20% in
the previous 12 months and which have been open for at least 12 consecutive months without closure for seven
or more consecutive days. By measuring the year-over-year sales of merchandise in the stores that have a history
of being open for a full comparable 12 months or more, we can better gauge how the core store base is
performing since it excludes new store openings, store remodelings and expansions. Comparable stores exclude
new retail concepts until such time as we believe that comparable store results in those concepts are of sufficient
size to evaluate the performance of the retail strategy, therefore, fiscal 2010, 2009 and 2008 total comparable
store sales exclude the West Elm and Williams-Sonoma Home concepts.
28