Pottery Barn 2010 Annual Report Download - page 58
Download and view the complete annual report
Please find page 58 of the 2010 Pottery Barn annual report below. You can navigate through the pages in the report by either clicking on the pages listed below, or by using the keyword search tool below to find specific information within the annual report.-
 1
1 -
2
-
3
-
4
-
5
-
6
-
7
-
8
-
9
-
10
-
11
-
12
-
13
-
14
-
15
-
16
-
17
-
18
-
19
-
20
-
21
-
22
-
23
-
24
-
25
-
26
-
27
-
28
-
29
-
30
-
31
-
32
-
33
-
34
-
35
-
36
-
37
-
38
-
39
-
40
-
41
-
42
-
43
-
44
-
45
-
46
-
47
-
 48
48 -
 49
49 -
 50
50 -
 51
51 -
 52
52 -
 53
53 -
 54
54 -
 55
55 -
 56
56 -
 57
57 -
 58
58 -
 59
59 -
 60
60 -
 61
61 -
 62
62 -
 63
63 -
 64
64 -
 65
65 -
 66
66 -
 67
67 -
 68
68 -
69
-
70
-
71
-
72
-
73
-
74
-
75
-
76
-
77
-
78
-
79
-
80
-
81
-
82
-
83
-
84
-
85
-
86
-
87
-
88
-
89
-
90
-
91
-
92
-
93
-
94
-
95
-
96
-
97
-
98
-
99
-
100
-
101
-
102
-
103
-
104
-
105
-
106
-
107
-
108
-
109
-
110
-
111
-
112
-
113
-
114
-
115
-
116
-
117
-
118
-
119
-
120
-
121
-
122
-
123
-
124
-
125
-
126
-
127
-
128
-
129
-
130
-
131
-
132
-
133
-
134
-
135
-
136
-
137
-
138
-
139
-
140
-
141
-
142
-
143
-
144
-
145
-
146
-
147
-
148
-
149
-
150
-
151
-
152
-
153
-
154
-
155
-
156
-
157
-
158
-
159
-
160
-
161
-
162
-
163
-
164
-
165
-
166
-
167
-
168
-
169
-
170
-
171
-
172
-
173
-
174
-
175
-
176
-
177
-
178
-
179
-
180
-
181
-
182
-
183
-
184
-
185
-
186
-
187
-
188
-
189
-
190
-
191
-
192
-
193
-
194
-
195
-
196
-
197
-
198
-
199
-
200
-
201
-
202
-
203
-
204
-
205
-
206
-
207
-
208
-
209
-
210
-
211
-
212
-
213
-
214
-
215
-
216
-
217
-
218
-
219
-
220
-
221
-
222
-
223
-
224
-
225
-
226
-
227
-
228
-
229
-
230
-
231
-
232
-
233
-
234
-
235
-
236
-
237
-
238
-
239
-
240
-
241
-
242
-
243
-
244
-
245
-
246
-
247
-
248
-
249
-
250
-
251
-
252
 |
 |

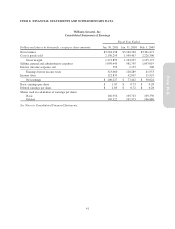
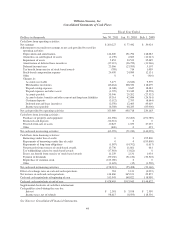
Williams-Sonoma, Inc.
Consolidated Statements of Cash Flows
Fiscal Year Ended
Dollars in thousands Jan. 30, 2011 Jan. 31, 2010 Feb. 1, 2009
Cash flows from operating activities:
Net earnings $ 200,227 $ 77,442 $ 30,024
Adjustments to reconcile net earnings to net cash provided by (used in)
operating activities:
Depreciation and amortization 144,630 151,796 148,083
(Gain)/loss on sale/disposal of assets (1,139) 2,603 (12,247)
Impairment of assets 5,453 30,533 35,449
Amortization of deferred lease incentives (37,115) (36,799) (31,266)
Deferred income taxes 23,566 (23,595) 5,107
Tax benefit from exercise of stock-based awards (789) 714 1,059
Stock-based compensation expense 26,630 24,989 12,131
Other 0 0 (416)
Changes in:
Accounts receivable 3,477 (6,620) 9,579
Merchandise inventories (46,464) 108,332 118,679
Prepaid catalog expenses (4,048) 3,647 18,483
Prepaid expenses and other assets (1,729) 23,349 (8,578)
Accounts payable 35,946 29,202 (27,532)
Accrued salaries, benefits and other current and long-term liabilities 19,314 42,084 (24,361)
Customer deposits (3,112) 2,353 (8,644)
Deferred rent and lease incentives (2,550) 12,403 49,619
Income taxes payable (6,308) 48,285 (85,006)
Net cash provided by operating activities 355,989 490,718 230,163
Cash flows from investing activities:
Purchases of property and equipment (61,906) (72,263) (191,789)
Restricted cash deposits (12,512) 0 0
Proceeds from sale of assets 10,823 1,033 47,257
Other (400) 0 493
Net cash used in investing activities (63,995) (71,230) (144,039)
Cash flows from financing activities:
Borrowings under line of credit 0 0 195,800
Repayments of borrowings under line of credit 0 0 (195,800)
Repayments of long-term obligations (1,587) (14,702) (1,617)
Net proceeds from exercise of stock-based awards 15,736 11,861 461
Tax withholdings related to stock-based awards (17,918) (3,621) 0
Excess tax benefit from exercise of stock-based awards 11,239 2,131 1,034
Payment of dividends (59,160) (51,132) (50,518)
Repurchase of common stock (125,000) 0 0
Other (1,625) (35) (1,520)
Net cash used in financing activities (178,315) (55,498) (52,160)
Effect of exchange rates on cash and cash equivalents 781 1,131 (4,092)
Net increase in cash and cash equivalents 114,460 365,121 29,872
Cash and cash equivalents at beginning of year 513,943 148,822 118,950
Cash and cash equivalents at end of year $ 628,403 $513,943 $ 148,822
Supplemental disclosure of cash flow information:
Cash paid/(received) during the year for:
Interest $ 2,381 $ 3,198 $ 2,550
Income taxes, net of refunds 98,617 (8,593) 118,356
See Notes to Consolidated Financial Statements.
44