Pottery Barn 2010 Annual Report Download - page 39
Download and view the complete annual report
Please find page 39 of the 2010 Pottery Barn annual report below. You can navigate through the pages in the report by either clicking on the pages listed below, or by using the keyword search tool below to find specific information within the annual report.-
 1
1 -
2
-
3
-
4
-
5
-
6
-
7
-
8
-
9
-
10
-
11
-
12
-
13
-
14
-
15
-
16
-
17
-
18
-
19
-
20
-
21
-
22
-
23
-
24
-
25
-
26
-
27
-
28
-
 29
29 -
 30
30 -
 31
31 -
 32
32 -
 33
33 -
 34
34 -
 35
35 -
 36
36 -
 37
37 -
 38
38 -
 39
39 -
 40
40 -
 41
41 -
 42
42 -
 43
43 -
 44
44 -
 45
45 -
 46
46 -
 47
47 -
 48
48 -
 49
49 -
50
-
51
-
52
-
53
-
54
-
55
-
56
-
57
-
58
-
59
-
60
-
61
-
62
-
63
-
64
-
65
-
66
-
67
-
68
-
69
-
70
-
71
-
72
-
73
-
74
-
75
-
76
-
77
-
78
-
79
-
80
-
81
-
82
-
83
-
84
-
85
-
86
-
87
-
88
-
89
-
90
-
91
-
92
-
93
-
94
-
95
-
96
-
97
-
98
-
99
-
100
-
101
-
102
-
103
-
104
-
105
-
106
-
107
-
108
-
109
-
110
-
111
-
112
-
113
-
114
-
115
-
116
-
117
-
118
-
119
-
120
-
121
-
122
-
123
-
124
-
125
-
126
-
127
-
128
-
129
-
130
-
131
-
132
-
133
-
134
-
135
-
136
-
137
-
138
-
139
-
140
-
141
-
142
-
143
-
144
-
145
-
146
-
147
-
148
-
149
-
150
-
151
-
152
-
153
-
154
-
155
-
156
-
157
-
158
-
159
-
160
-
161
-
162
-
163
-
164
-
165
-
166
-
167
-
168
-
169
-
170
-
171
-
172
-
173
-
174
-
175
-
176
-
177
-
178
-
179
-
180
-
181
-
182
-
183
-
184
-
185
-
186
-
187
-
188
-
189
-
190
-
191
-
192
-
193
-
194
-
195
-
196
-
197
-
198
-
199
-
200
-
201
-
202
-
203
-
204
-
205
-
206
-
207
-
208
-
209
-
210
-
211
-
212
-
213
-
214
-
215
-
216
-
217
-
218
-
219
-
220
-
221
-
222
-
223
-
224
-
225
-
226
-
227
-
228
-
229
-
230
-
231
-
232
-
233
-
234
-
235
-
236
-
237
-
238
-
239
-
240
-
241
-
242
-
243
-
244
-
245
-
246
-
247
-
248
-
249
-
250
-
251
-
252
 |
 |

ITEM 7. MANAGEMENT’S DISCUSSION AND ANALYSIS OF FINANCIAL CONDITION AND
RESULTS OF OPERATIONS
The following discussion and analysis of our financial condition, results of operations, and liquidity and capital
resources for the 52 weeks ended January 30, 2011 (“fiscal 2010”), the 52 weeks ended January 31, 2010 (“fiscal
2009”), and the 52 weeks ended February 1, 2009 (“fiscal 2008”) should be read in conjunction with our
consolidated financial statements and notes thereto. All explanations of changes in operational results are
discussed in order of magnitude.
OVERVIEW
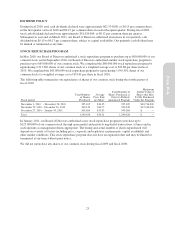
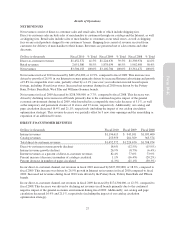
Fiscal 2010 Financial Results
Fiscal 2010 was a year of record performance for our company. Each of our brands ended the year stronger than
it began, and aggressive and proactive initiatives across the organization led to new milestones in profitability.
We are pleased with the progress we made in merchandising, marketing, customer acquisition and customer
service, as it was these initiatives that we believe have allowed us to attract new customers to our brands and gain
profitable market share all year. In fiscal 2010, our net revenues increased 12.9% to $3,504,158,000 compared to
$3,102,704,000 in fiscal 2009 and we increased our fiscal 2010 diluted earnings per share to $1.83 versus $0.72
in fiscal 2009. We also ended the year with $628,403,000 in cash after returning nearly $185,000,000 to our
shareholders through stock repurchases and dividends.
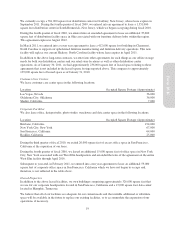
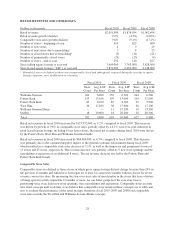
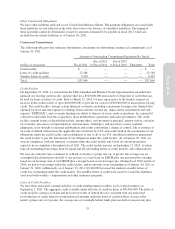
In our direct-to-customer channel, net revenues in fiscal 2010 increased by $227,902,000, or 18.6%, compared to
fiscal 2009. This increase was driven by 26.9% growth in Internet net revenues in fiscal 2010 compared to fiscal
2009. Increased net revenues during fiscal 2010 were driven by the Pottery Barn, Pottery Barn Kids and PBteen
brands.
Retail net revenues in fiscal 2010 increased by $173,552,000, or 9.2%, compared to fiscal 2009. This increase
was driven by growth of 9.8% in comparable store sales, partially offset by a 4.1% year-over-year reduction in
retail leased square footage, including 18 net fewer stores. Increased net revenues during fiscal 2010 were driven
by the Pottery Barn, West Elm and Williams-Sonoma brands.
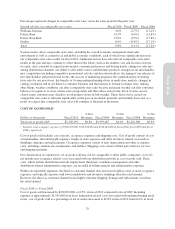
In our core brands, net revenues increased 12.3% compared to fiscal 2009 led by growth in the Pottery Barn
brand. Sales trends improved in every concept and we saw significant growth in new customer acquisition.
In our emerging brands, net revenues increased 17.1% led by West Elm and PBteen, which continued to see net
revenue and operating margin increases. In Williams-Sonoma Home, we completed the retail restructuring of the
brand by closing all stand-alone retail stores.
Fiscal 2010 Operational Results
In our supply chain, we continued to see ongoing customer service and cost reduction benefits from our
distribution, transportation, packaging, and quality returns initiatives. These initiatives included: implementing
the first phase of our multi-year east coast distribution center consolidation; optimizing our inbound and
outbound packaging; improving efficiency in our personalization operations; and consolidating shipments of
customers’ furniture and non-furniture orders into one delivery.
Another significant supply chain initiative was Asian sourcing where we expanded our in-country operations.
This initiative has allowed us to establish factory specific expertise, improve vendor performance and reduce
returns, replacements and damages. We are gaining similar efficiencies from the expansion of our North Carolina
upholstered furniture operation, which is now a major supplier of our upholstered furniture.
In information technology, we made significant progress in e-commerce, particularly in the areas of on-site
search, customer engagement, mobile and social media. All of these investments drove increased traffic, higher
conversion and a superior on-site experience for our customers. We also launched new e-gift card functionality in
all brands and a new member-based shipping program in the Williams-Sonoma brand. In direct marketing, we
implemented new functionality that allowed us to make significant advancements in the relevance of our
e-marketing programs.
25
Form 10-K