Pottery Barn 2010 Annual Report Download - page 41
Download and view the complete annual report
Please find page 41 of the 2010 Pottery Barn annual report below. You can navigate through the pages in the report by either clicking on the pages listed below, or by using the keyword search tool below to find specific information within the annual report.-
 1
1 -
2
-
3
-
4
-
5
-
6
-
7
-
8
-
9
-
10
-
11
-
12
-
13
-
14
-
15
-
16
-
17
-
18
-
19
-
20
-
21
-
22
-
23
-
24
-
25
-
26
-
27
-
28
-
29
-
30
-
 31
31 -
 32
32 -
 33
33 -
 34
34 -
 35
35 -
 36
36 -
 37
37 -
 38
38 -
 39
39 -
 40
40 -
 41
41 -
 42
42 -
 43
43 -
 44
44 -
 45
45 -
 46
46 -
 47
47 -
 48
48 -
 49
49 -
 50
50 -
 51
51 -
52
-
53
-
54
-
55
-
56
-
57
-
58
-
59
-
60
-
61
-
62
-
63
-
64
-
65
-
66
-
67
-
68
-
69
-
70
-
71
-
72
-
73
-
74
-
75
-
76
-
77
-
78
-
79
-
80
-
81
-
82
-
83
-
84
-
85
-
86
-
87
-
88
-
89
-
90
-
91
-
92
-
93
-
94
-
95
-
96
-
97
-
98
-
99
-
100
-
101
-
102
-
103
-
104
-
105
-
106
-
107
-
108
-
109
-
110
-
111
-
112
-
113
-
114
-
115
-
116
-
117
-
118
-
119
-
120
-
121
-
122
-
123
-
124
-
125
-
126
-
127
-
128
-
129
-
130
-
131
-
132
-
133
-
134
-
135
-
136
-
137
-
138
-
139
-
140
-
141
-
142
-
143
-
144
-
145
-
146
-
147
-
148
-
149
-
150
-
151
-
152
-
153
-
154
-
155
-
156
-
157
-
158
-
159
-
160
-
161
-
162
-
163
-
164
-
165
-
166
-
167
-
168
-
169
-
170
-
171
-
172
-
173
-
174
-
175
-
176
-
177
-
178
-
179
-
180
-
181
-
182
-
183
-
184
-
185
-
186
-
187
-
188
-
189
-
190
-
191
-
192
-
193
-
194
-
195
-
196
-
197
-
198
-
199
-
200
-
201
-
202
-
203
-
204
-
205
-
206
-
207
-
208
-
209
-
210
-
211
-
212
-
213
-
214
-
215
-
216
-
217
-
218
-
219
-
220
-
221
-
222
-
223
-
224
-
225
-
226
-
227
-
228
-
229
-
230
-
231
-
232
-
233
-
234
-
235
-
236
-
237
-
238
-
239
-
240
-
241
-
242
-
243
-
244
-
245
-
246
-
247
-
248
-
249
-
250
-
251
-
252
 |
 |

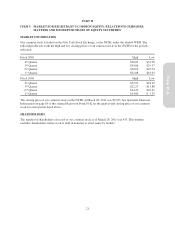
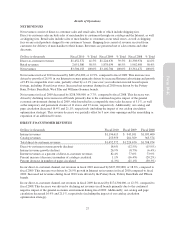
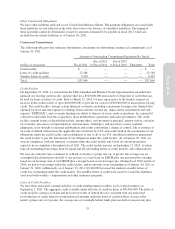
Results of Operations
NET REVENUES
Net revenues consist of direct-to-customer sales and retail sales, both of which include shipping fees.
Direct-to-customer sales include sales of merchandise to customers through our catalogs and the Internet, as well
as shipping fees. Retail sales include sales of merchandise to customers at our retail stores, as well as shipping
fees on any retail products shipped to our customers’ homes. Shipping fees consist of revenue received from
customers for delivery of merchandise to their homes. Revenues are presented net of sales returns and other
discounts.
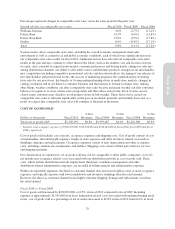
Dollars in thousands Fiscal 2010 % Total Fiscal 2009 % Total Fiscal 2008 % Total
Direct-to-customer revenues $1,452,572 41.5% $1,224,670 39.5% $1,398,974 41.6%
Retail revenues 2,051,586 58.5% 1,878,034 60.5% 1,962,498 58.4%
Net revenues $3,504,158 100.0% $3,102,704 100.0% $3,361,472 100.0%
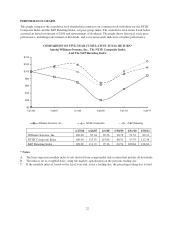
Net revenues in fiscal 2010 increased by $401,454,000, or 12.9%, compared to fiscal 2009. This increase was
driven by growth of 26.9% in our Internet revenues primarily driven by increased Internet advertising and growth
of 9.8% in comparable store sales, partially offset by a 4.1% year-over-year reduction in retail leased square
footage, including 18 net fewer stores. Increased net revenues during fiscal 2010 were driven by the Pottery
Barn, Pottery Barn Kids, West Elm and Williams-Sonoma brands.
Net revenues in fiscal 2009 decreased by $258,768,000, or 7.7%, compared to fiscal 2008. This decrease was
driven by declining net revenues in all brands primarily due to the continued negative impact of the general
economic environment during fiscal 2009, which resulted in a comparable store sales decrease of 5.1%, as well
as the temporary and permanent closure of 11 stores and 23 stores, respectively. Additionally, our catalog and
page circulation decreased 16.4% and 21.1%, respectively (including the impact of our catalog circulation
optimization strategy). This revenue decrease was partially offset by 9 new store openings and the remodeling or
expansion of an additional 8 stores.
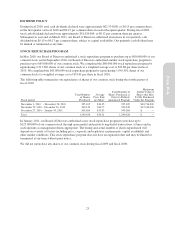
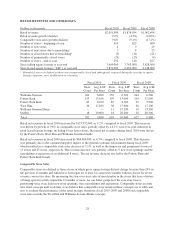
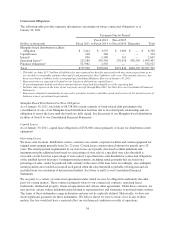
DIRECT-TO-CUSTOMER REVENUES
Dollars in thousands Fiscal 2010 Fiscal 2009 Fiscal 2008
Internet revenues $1,196,613 $ 943,101 $1,033,400
Catalog revenues 255,959 281,569 365,574
Total direct-to-customer revenues $1,452,572 $1,224,670 $1,398,974
Direct-to-customer revenue growth (decline) 18.6% (12.5%) (15.9%)
Internet revenue growth (decline) 26.9% (8.7%) (6.4%)
Internet revenues as a percent of direct-to-customer revenues 82.4% 77.0% 73.9%
Percent increase (decrease) in number of catalogs circulated 1.1% (16.4%) (20.2%)
Percent decrease in number of pages circulated (1.3%) (21.1%) (30.3%)
In our direct-to-customer channel, net revenues in fiscal 2010 increased by $227,902,000, or 18.6%, compared to
fiscal 2009. This increase was driven by 26.9% growth in Internet net revenues in fiscal 2010 compared to fiscal
2009. Increased net revenues during fiscal 2010 were driven by the Pottery Barn, Pottery Barn Kids and PBteen
brands.
In our direct-to-customer channel, net revenues in fiscal 2009 decreased by $174,304,000, or 12.5%, compared to
fiscal 2008. This decrease was driven by declining net revenues in all brands primarily due to the continued
negative impact of the general economic environment during fiscal 2009. Additionally, our catalog and page
circulation decreased 16.4% and 21.1%, respectively (including the impact of our catalog circulation
optimization strategy).
27
Form 10-K