Pottery Barn 2010 Annual Report Download - page 75
Download and view the complete annual report
Please find page 75 of the 2010 Pottery Barn annual report below. You can navigate through the pages in the report by either clicking on the pages listed below, or by using the keyword search tool below to find specific information within the annual report.-
 1
1 -
2
-
3
-
4
-
5
-
6
-
7
-
8
-
9
-
10
-
11
-
12
-
13
-
14
-
15
-
16
-
17
-
18
-
19
-
20
-
21
-
22
-
23
-
24
-
25
-
26
-
27
-
28
-
29
-
30
-
31
-
32
-
33
-
34
-
35
-
36
-
37
-
38
-
39
-
40
-
41
-
42
-
43
-
44
-
45
-
46
-
47
-
48
-
49
-
50
-
51
-
52
-
53
-
54
-
55
-
56
-
57
-
58
-
59
-
60
-
61
-
62
-
63
-
64
-
 65
65 -
 66
66 -
 67
67 -
 68
68 -
 69
69 -
 70
70 -
 71
71 -
 72
72 -
 73
73 -
 74
74 -
 75
75 -
 76
76 -
 77
77 -
 78
78 -
 79
79 -
 80
80 -
 81
81 -
 82
82 -
 83
83 -
 84
84 -
 85
85 -
86
-
87
-
88
-
89
-
90
-
91
-
92
-
93
-
94
-
95
-
96
-
97
-
98
-
99
-
100
-
101
-
102
-
103
-
104
-
105
-
106
-
107
-
108
-
109
-
110
-
111
-
112
-
113
-
114
-
115
-
116
-
117
-
118
-
119
-
120
-
121
-
122
-
123
-
124
-
125
-
126
-
127
-
128
-
129
-
130
-
131
-
132
-
133
-
134
-
135
-
136
-
137
-
138
-
139
-
140
-
141
-
142
-
143
-
144
-
145
-
146
-
147
-
148
-
149
-
150
-
151
-
152
-
153
-
154
-
155
-
156
-
157
-
158
-
159
-
160
-
161
-
162
-
163
-
164
-
165
-
166
-
167
-
168
-
169
-
170
-
171
-
172
-
173
-
174
-
175
-
176
-
177
-
178
-
179
-
180
-
181
-
182
-
183
-
184
-
185
-
186
-
187
-
188
-
189
-
190
-
191
-
192
-
193
-
194
-
195
-
196
-
197
-
198
-
199
-
200
-
201
-
202
-
203
-
204
-
205
-
206
-
207
-
208
-
209
-
210
-
211
-
212
-
213
-
214
-
215
-
216
-
217
-
218
-
219
-
220
-
221
-
222
-
223
-
224
-
225
-
226
-
227
-
228
-
229
-
230
-
231
-
232
-
233
-
234
-
235
-
236
-
237
-
238
-
239
-
240
-
241
-
242
-
243
-
244
-
245
-
246
-
247
-
248
-
249
-
250
-
251
-
252
 |
 |

We did not repurchase any shares of our common stock during fiscal 2009 and fiscal 2008.
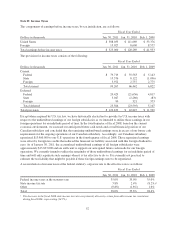
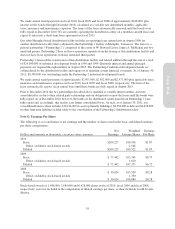
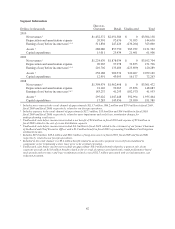
Note M: Segment Reporting
As of January 30, 2011, we have two reportable segments, direct-to-customer and retail. The direct-to-customer
segment has six merchandising concepts (Williams-Sonoma, Pottery Barn, Pottery Barn Kids, PBteen, West Elm
and Williams-Sonoma Home) and sells our products through our six direct mail catalogs (Williams-Sonoma,
Pottery Barn, Pottery Barn Kids, Pottery Barn Bed and Bath, PBteen and West Elm) and six e-commerce
websites (williams-sonoma.com, potterybarn.com, potterybarnkids.com, pbteen.com, westelm.com and
wshome.com). The retail segment has four merchandising concepts which sell products for the home (Williams-
Sonoma, Pottery Barn, Pottery Barn Kids, and West Elm). The four retail merchandising concepts are operating
segments, which have been aggregated into one reportable segment, retail. Management’s expectation is that the
overall economic characteristics of each of our major concepts within each reportable segment will be similar
over time based on management’s judgment that the operating segments have had similar historical economic
characteristics and are expected to have similar long-term financial performance in the future.
These reportable segments are strategic business units that offer similar home-centered products. They are
managed separately because the business units utilize two distinct distribution and marketing strategies. Based on
management’s best estimate, our operating segments include allocations of certain expenses, including
advertising and employment costs, to the extent they have been determined to benefit both channels. These
operating segments are aggregated at the channel level for reporting purposes due to the fact that our brands are
interdependent for economies of scale and we do not maintain fully allocated income statements at the brand
level. As a result, material financial decisions related to the brands are made at the channel level. Furthermore, it
is not practicable for us to report revenue by product group.
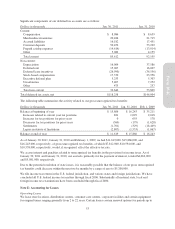
We use earnings before unallocated corporate overhead, interest and taxes to evaluate segment profitability.
Unallocated costs before income taxes include corporate employee-related costs, occupancy expenses (including
depreciation expense), administrative costs and third party service costs, primarily in our corporate systems,
corporate facilities and other administrative departments. Unallocated assets include the net book value of
corporate facilities and related information systems, deferred income taxes, other corporate long-lived assets and
corporate cash and cash equivalents.
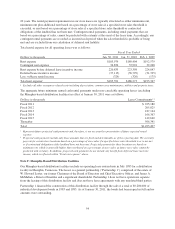
Income tax information by segment has not been included as taxes are calculated at a company-wide level and
are not allocated to each segment.
61
Form 10-K