Pottery Barn 2010 Annual Report Download - page 32
Download and view the complete annual report
Please find page 32 of the 2010 Pottery Barn annual report below. You can navigate through the pages in the report by either clicking on the pages listed below, or by using the keyword search tool below to find specific information within the annual report.-
 1
1 -
2
-
3
-
4
-
5
-
6
-
7
-
8
-
9
-
10
-
11
-
12
-
13
-
14
-
15
-
16
-
17
-
18
-
19
-
20
-
21
-
 22
22 -
 23
23 -
 24
24 -
 25
25 -
 26
26 -
 27
27 -
 28
28 -
 29
29 -
 30
30 -
 31
31 -
 32
32 -
 33
33 -
 34
34 -
 35
35 -
 36
36 -
 37
37 -
 38
38 -
 39
39 -
 40
40 -
 41
41 -
 42
42 -
43
-
44
-
45
-
46
-
47
-
48
-
49
-
50
-
51
-
52
-
53
-
54
-
55
-
56
-
57
-
58
-
59
-
60
-
61
-
62
-
63
-
64
-
65
-
66
-
67
-
68
-
69
-
70
-
71
-
72
-
73
-
74
-
75
-
76
-
77
-
78
-
79
-
80
-
81
-
82
-
83
-
84
-
85
-
86
-
87
-
88
-
89
-
90
-
91
-
92
-
93
-
94
-
95
-
96
-
97
-
98
-
99
-
100
-
101
-
102
-
103
-
104
-
105
-
106
-
107
-
108
-
109
-
110
-
111
-
112
-
113
-
114
-
115
-
116
-
117
-
118
-
119
-
120
-
121
-
122
-
123
-
124
-
125
-
126
-
127
-
128
-
129
-
130
-
131
-
132
-
133
-
134
-
135
-
136
-
137
-
138
-
139
-
140
-
141
-
142
-
143
-
144
-
145
-
146
-
147
-
148
-
149
-
150
-
151
-
152
-
153
-
154
-
155
-
156
-
157
-
158
-
159
-
160
-
161
-
162
-
163
-
164
-
165
-
166
-
167
-
168
-
169
-
170
-
171
-
172
-
173
-
174
-
175
-
176
-
177
-
178
-
179
-
180
-
181
-
182
-
183
-
184
-
185
-
186
-
187
-
188
-
189
-
190
-
191
-
192
-
193
-
194
-
195
-
196
-
197
-
198
-
199
-
200
-
201
-
202
-
203
-
204
-
205
-
206
-
207
-
208
-
209
-
210
-
211
-
212
-
213
-
214
-
215
-
216
-
217
-
218
-
219
-
220
-
221
-
222
-
223
-
224
-
225
-
226
-
227
-
228
-
229
-
230
-
231
-
232
-
233
-
234
-
235
-
236
-
237
-
238
-
239
-
240
-
241
-
242
-
243
-
244
-
245
-
246
-
247
-
248
-
249
-
250
-
251
-
252
 |
 |

safeguards or to detect and provide prompt notice of unauthorized access as required by some of these new laws,
we could be subject to potential claims for damages and other remedies, which could harm our business.
Fluctuations in our tax obligations and effective tax rate may result in volatility of our operating results and
stock price.
We are subject to income taxes in many U.S. and certain foreign jurisdictions. We record tax expense based on
our estimates of future payments, which include reserves for estimates of probable settlements of foreign and
domestic tax audits. At any one time, many tax years are subject to audit by various taxing jurisdictions. The
results of these audits and negotiations with taxing authorities may affect the ultimate settlement of these issues.
As a result, we expect that throughout the year there could be ongoing variability in our quarterly tax rates as
taxable events occur and exposures are evaluated. In addition, our effective tax rate in a given financial statement
period may be materially impacted by changes in the mix and level of earnings or by changes to existing
accounting rules or regulations. Further, there is proposed tax legislation that may be enacted in the future, which
could negatively impact our current or future tax structure and effective tax rates.
If we fail to attract and retain key personnel, our business and operating results may be harmed.
Our future success depends to a significant degree on the skills, experience and efforts of key personnel in our
senior management, whose vision for our company, knowledge of our business and expertise would be difficult
to replace. If any of our key employees leaves, is seriously injured or is unable to work, and we are unable to find
a qualified replacement, we may be unable to execute our business strategy.
In addition, our main offices are located in the San Francisco Bay Area, where competition for personnel with
retail and technology skills can be intense. If we fail to identify, attract, retain and motivate these skilled
personnel, especially in this challenging economic environment, our business may be harmed. Further, in the
event we need to hire additional personnel, we may experience difficulties in attracting and successfully hiring
such individuals due to competition for highly skilled personnel, as well as the significantly higher cost of living
expenses in our market.
ITEM 1B. UNRESOLVED STAFF COMMENTS
None.
ITEM 2. PROPERTIES
We lease store locations, distribution centers, customer care centers and corporate facilities for original terms
ranging generally from 2 to 22 years. Certain leases contain renewal options for periods of up to 20 years.
For our store locations, our gross leased store space, as of January 30, 2011, totaled approximately 5,831,000
square feet for 592 stores compared to approximately 6,081,000 square feet for 610 stores as of January 31, 2010.
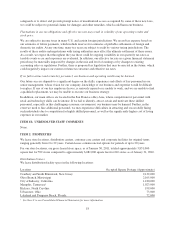
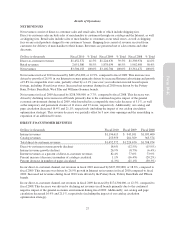
Distribution Centers
We lease distribution facility space in the following locations:
Location Occupied Square Footage (Approximate)
Cranbury and South Brunswick, New Jersey 2,132,000
Olive Branch, Mississippi 2,105,000
City of Industry, California 1,180,000
Memphis, Tennessee11,023,000
Hickory, North Carolina 199,000
Urbancrest, Ohio 73,000
Lakeland and Pompano Beach, Florida 72,000
1See Note F to our Consolidated Financial Statements for more information.
18