Pottery Barn 2010 Annual Report Download - page 46
Download and view the complete annual report
Please find page 46 of the 2010 Pottery Barn annual report below. You can navigate through the pages in the report by either clicking on the pages listed below, or by using the keyword search tool below to find specific information within the annual report.-
 1
1 -
2
-
3
-
4
-
5
-
6
-
7
-
8
-
9
-
10
-
11
-
12
-
13
-
14
-
15
-
16
-
17
-
18
-
19
-
20
-
21
-
22
-
23
-
24
-
25
-
26
-
27
-
28
-
29
-
30
-
31
-
32
-
33
-
34
-
35
-
 36
36 -
 37
37 -
 38
38 -
 39
39 -
 40
40 -
 41
41 -
 42
42 -
 43
43 -
 44
44 -
 45
45 -
 46
46 -
 47
47 -
 48
48 -
 49
49 -
 50
50 -
 51
51 -
 52
52 -
 53
53 -
 54
54 -
 55
55 -
 56
56 -
57
-
58
-
59
-
60
-
61
-
62
-
63
-
64
-
65
-
66
-
67
-
68
-
69
-
70
-
71
-
72
-
73
-
74
-
75
-
76
-
77
-
78
-
79
-
80
-
81
-
82
-
83
-
84
-
85
-
86
-
87
-
88
-
89
-
90
-
91
-
92
-
93
-
94
-
95
-
96
-
97
-
98
-
99
-
100
-
101
-
102
-
103
-
104
-
105
-
106
-
107
-
108
-
109
-
110
-
111
-
112
-
113
-
114
-
115
-
116
-
117
-
118
-
119
-
120
-
121
-
122
-
123
-
124
-
125
-
126
-
127
-
128
-
129
-
130
-
131
-
132
-
133
-
134
-
135
-
136
-
137
-
138
-
139
-
140
-
141
-
142
-
143
-
144
-
145
-
146
-
147
-
148
-
149
-
150
-
151
-
152
-
153
-
154
-
155
-
156
-
157
-
158
-
159
-
160
-
161
-
162
-
163
-
164
-
165
-
166
-
167
-
168
-
169
-
170
-
171
-
172
-
173
-
174
-
175
-
176
-
177
-
178
-
179
-
180
-
181
-
182
-
183
-
184
-
185
-
186
-
187
-
188
-
189
-
190
-
191
-
192
-
193
-
194
-
195
-
196
-
197
-
198
-
199
-
200
-
201
-
202
-
203
-
204
-
205
-
206
-
207
-
208
-
209
-
210
-
211
-
212
-
213
-
214
-
215
-
216
-
217
-
218
-
219
-
220
-
221
-
222
-
223
-
224
-
225
-
226
-
227
-
228
-
229
-
230
-
231
-
232
-
233
-
234
-
235
-
236
-
237
-
238
-
239
-
240
-
241
-
242
-
243
-
244
-
245
-
246
-
247
-
248
-
249
-
250
-
251
-
252
 |
 |
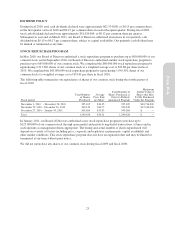
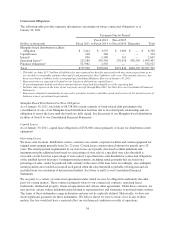
landlord to compensate us for terminating a store lease prior to its original expiration recorded in fiscal 2008 that
did not recur in fiscal 2009.
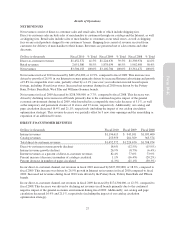
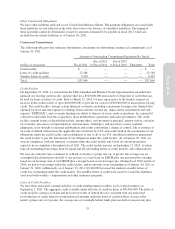
INCOME TAXES
Our effective income tax rate was 38.0% for fiscal 2010, 35.6% for fiscal 2009 and 28.4% for fiscal 2008. The
increase in the effective income tax rate in fiscal 2010 over fiscal 2009 was primarily driven by certain favorable
income tax resolutions that had a larger impact on the fiscal 2009 tax rate due to the lower level of earnings in
fiscal 2009.
We currently expect our fiscal 2011 effective tax rate to be in the range of 37% to 39%. Throughout the year, we
expect that there could be ongoing variability in our quarterly tax rates as changes in the level of earnings can
increase the volatility of our tax rate. Additionally, our quarterly tax rate may continue to experience ongoing
variability as taxable events occur and uncertain tax positions are re-evaluated for changes in events or
circumstances, settlements, or expiration of statutes of limitations.
LIQUIDITY AND CAPITAL RESOURCES
As of January 30, 2011, we held $628,403,000 in cash and cash equivalent funds, the majority of which are held
in money market funds and highly liquid U.S. Treasury bills. As is consistent with our industry, our cash
balances are seasonal in nature, with the fourth quarter historically representing a significantly higher level of
cash than other periods.
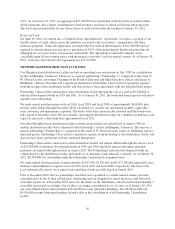
Throughout the fiscal year, we utilize our cash balances to build our inventory levels in preparation for our fourth
quarter holiday sales. In fiscal 2010, our cash resources were used to fund our inventory and inventory-related
purchases, advertising and marketing initiatives, stock repurchases, purchases of property and equipment and
dividend payments. In addition to the current cash balances on hand, we have a credit facility that provides for a
$300,000,000 unsecured revolving line of credit that may be used for loans or letters of credit. Prior to March 23,
2015, we may, upon notice to the lenders, request an increase in the credit facility of up to $200,000,000 to
provide for a total of $500,000,000 of unsecured revolving credit. During fiscal 2010 and fiscal 2009, we had no
borrowings under the credit facility, and no amounts were outstanding as of January 30, 2011 or January 31,
2010. Additionally, as of January 30, 2011, $9,420,000 in issued but undrawn standby letters of credit was
outstanding under the credit facility. Further, as of January 30, 2011, we had three unsecured letter of credit
reimbursement facilities for a total of $90,000,000, of which an aggregate of $27,584,000 was outstanding as of
January 30, 2011. These letter of credit facilities represent only a future commitment to fund inventory purchases
to which we had not taken legal title. We are currently in compliance with all of our bank covenants and, based
on our current projections, we expect to remain in compliance throughout fiscal 2011. We believe our cash on
hand, in addition to our available credit facilities, will provide adequate liquidity for our business operations over
the next 12 months.
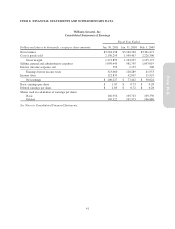
In fiscal 2010, net cash provided by operating activities was $355,989,000 compared to net cash provided by
operating activities of $490,718,000 in fiscal 2009. Net cash provided by operating activities in fiscal 2010 was
primarily attributable to net earnings, and an increase in accounts payable and accrued liabilities, partially offset
by an increase in merchandise inventories. Net cash provided by operating activities in fiscal 2010 decreased
compared to fiscal 2009 primarily due to an increase in merchandise inventories and a decrease in income taxes
payable, partially offset by an increase in fiscal 2010 net earnings.
In fiscal 2009, net cash provided by operating activities was $490,718,000 compared to net cash provided by
operating activities of $230,163,000 in fiscal 2008. Net cash provided by operating activities in fiscal 2009 was
primarily attributable to a decrease in merchandise inventories due to our inventory reduction initiatives
throughout fiscal 2009, an increase in income taxes payable resulting from an increase in earnings, as well as an
increase in accounts payable and accrued salaries, benefits and other expenses due to the timing of expenditures.
Net cash provided by operating activities in fiscal 2009 increased compared to fiscal 2008 primarily due to an
increase in income taxes payable, an increase in accrued salaries, benefits and other expenses and an increase in
accounts payable.
32