Pottery Barn 2010 Annual Report Download - page 164
Download and view the complete annual report
Please find page 164 of the 2010 Pottery Barn annual report below. You can navigate through the pages in the report by either clicking on the pages listed below, or by using the keyword search tool below to find specific information within the annual report.-
 1
1 -
2
-
3
-
4
-
5
-
6
-
7
-
8
-
9
-
10
-
11
-
12
-
13
-
14
-
15
-
16
-
17
-
18
-
19
-
20
-
21
-
22
-
23
-
24
-
25
-
26
-
27
-
28
-
29
-
30
-
31
-
32
-
33
-
34
-
35
-
36
-
37
-
38
-
39
-
40
-
41
-
42
-
43
-
44
-
45
-
46
-
47
-
48
-
49
-
50
-
51
-
52
-
53
-
54
-
55
-
56
-
57
-
58
-
59
-
60
-
61
-
62
-
63
-
64
-
65
-
66
-
67
-
68
-
69
-
70
-
71
-
72
-
73
-
74
-
75
-
76
-
77
-
78
-
79
-
80
-
81
-
82
-
83
-
84
-
85
-
86
-
87
-
88
-
89
-
90
-
91
-
92
-
93
-
94
-
95
-
96
-
97
-
98
-
99
-
100
-
101
-
102
-
103
-
104
-
105
-
106
-
107
-
108
-
109
-
110
-
111
-
112
-
113
-
114
-
115
-
116
-
117
-
118
-
119
-
120
-
121
-
122
-
123
-
124
-
125
-
126
-
127
-
128
-
129
-
130
-
131
-
132
-
133
-
134
-
135
-
136
-
137
-
138
-
139
-
140
-
141
-
142
-
143
-
144
-
145
-
146
-
147
-
148
-
149
-
150
-
151
-
152
-
153
-
 154
154 -
 155
155 -
 156
156 -
 157
157 -
 158
158 -
 159
159 -
 160
160 -
 161
161 -
 162
162 -
 163
163 -
 164
164 -
 165
165 -
 166
166 -
 167
167 -
 168
168 -
 169
169 -
 170
170 -
 171
171 -
 172
172 -
 173
173 -
 174
174 -
175
-
176
-
177
-
178
-
179
-
180
-
181
-
182
-
183
-
184
-
185
-
186
-
187
-
188
-
189
-
190
-
191
-
192
-
193
-
194
-
195
-
196
-
197
-
198
-
199
-
200
-
201
-
202
-
203
-
204
-
205
-
206
-
207
-
208
-
209
-
210
-
211
-
212
-
213
-
214
-
215
-
216
-
217
-
218
-
219
-
220
-
221
-
222
-
223
-
224
-
225
-
226
-
227
-
228
-
229
-
230
-
231
-
232
-
233
-
234
-
235
-
236
-
237
-
238
-
239
-
240
-
241
-
242
-
243
-
244
-
245
-
246
-
247
-
248
-
249
-
250
-
251
-
252
 |
 |

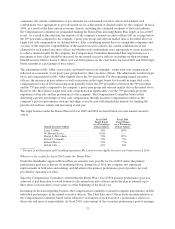
The Compensation Committee strives to ensure that the company’s total compensation packages and executive
compensation are aligned with market pay levels and practices. In order to achieve such goals, the Compensation
Committee takes into account the relationships among base salary, short-term incentive compensation and long-
term equity compensation at other companies considered to be comparable each year, collectively referred to as
“comparable companies” or our “proxy peer group.”
Our proxy peer group consists of other retail companies that are comparable to our company in one or more
significant ways: they may be specialty retailers, they may be of similar revenue size and market-capitalization
value, or they may compete with us for executive talent in our geographic markets. Historically, the comparable
group of companies has not changed significantly. For fiscal 2010 our peer group was identical to our fiscal 2009
peer group and the group of comparable companies consisted of 15 public companies: Abercrombie & Fitch,
American Eagle Outfitters, AnnTaylor Stores, Barnes & Noble, Bed Bath & Beyond, Foot Locker, The Gap,
Gymboree, Limited Brands, Men’s Wearhouse, Nordstrom, Pier 1 Imports, Ross Stores, Saks and Tiffany & Co.
This proxy peer group was determined originally for fiscal 2009 by the Compensation Committee considering the
following criteria, which reflects the company’s profile currently and at the time it was selected:
1. Company Classification in the Global Sub-Industry Classification System (GICS) in one of the
following:
• Home Furnishing Retail
• Apparel Retail
• Department Stores
2. Revenues between $1 billion and $12 billion
3. Market capitalization greater than $1 billion
4. More than 15,000 employees
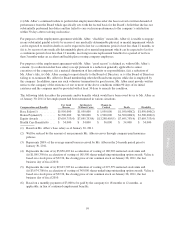
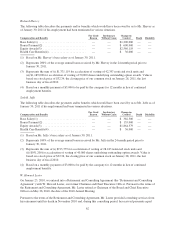
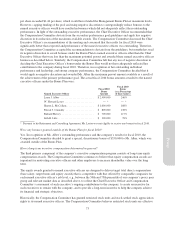
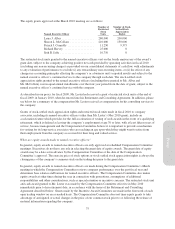
The following table, which is based on publicly available information as of January 31, 2011 as provided by
Cook & Co., provides a financial overview of the comparable companies to illustrate their revenues, income and
market capitalization as a group relative to the company. The Compensation Committee may review additional
benchmarking surveys and proxy data providing summarized data levels of base salary, target annual cash
incentives, and equity-based and other long-term incentives to assess market competitiveness of our
compensation programs for our named executive officers.
Annual
Net Revenue
(in millions)
Annual
Net Income
(in millions)
Market Capitalization
(in millions)
(as of 1/31/2011)
75th Percentile ........................................ $8,340 $594 $8,705
Average ............................................. $5,631 $356 $5,306
Median .............................................. $4,259 $160 $3,628
25th Percentile ........................................ $2,831 $ 74 $1,510
Williams-Sonoma, Inc. ................................. $3,103 $ 77 $3,395
The Compensation Committee did not change the proxy peer group for fiscal 2010.
How are base salaries determined?
Base salaries are paid to provide executives and other employees with a minimum fixed level of cash
compensation each year. The Compensation Committee believes that executive officers’ base salaries must be
sufficiently competitive to attract and retain key executives, and believes targeting base salaries at or near the
median among the proxy peer group is generally appropriate to meet these objectives. Accordingly, base pay and
annual increases are determined by analyzing each individual’s salary and total target compensation relative to
total salary and target compensation for similar positions at comparable companies and through a subjective
recommendation made by the Chief Executive Officer based on each executive’s experience and past and
anticipated contributions to the company’s success. In determining executive base salaries, the Compensation
68