Pottery Barn 2010 Annual Report Download - page 47
Download and view the complete annual report
Please find page 47 of the 2010 Pottery Barn annual report below. You can navigate through the pages in the report by either clicking on the pages listed below, or by using the keyword search tool below to find specific information within the annual report.-
 1
1 -
2
-
3
-
4
-
5
-
6
-
7
-
8
-
9
-
10
-
11
-
12
-
13
-
14
-
15
-
16
-
17
-
18
-
19
-
20
-
21
-
22
-
23
-
24
-
25
-
26
-
27
-
28
-
29
-
30
-
31
-
32
-
33
-
34
-
35
-
36
-
 37
37 -
 38
38 -
 39
39 -
 40
40 -
 41
41 -
 42
42 -
 43
43 -
 44
44 -
 45
45 -
 46
46 -
 47
47 -
 48
48 -
 49
49 -
 50
50 -
 51
51 -
 52
52 -
 53
53 -
 54
54 -
 55
55 -
 56
56 -
 57
57 -
58
-
59
-
60
-
61
-
62
-
63
-
64
-
65
-
66
-
67
-
68
-
69
-
70
-
71
-
72
-
73
-
74
-
75
-
76
-
77
-
78
-
79
-
80
-
81
-
82
-
83
-
84
-
85
-
86
-
87
-
88
-
89
-
90
-
91
-
92
-
93
-
94
-
95
-
96
-
97
-
98
-
99
-
100
-
101
-
102
-
103
-
104
-
105
-
106
-
107
-
108
-
109
-
110
-
111
-
112
-
113
-
114
-
115
-
116
-
117
-
118
-
119
-
120
-
121
-
122
-
123
-
124
-
125
-
126
-
127
-
128
-
129
-
130
-
131
-
132
-
133
-
134
-
135
-
136
-
137
-
138
-
139
-
140
-
141
-
142
-
143
-
144
-
145
-
146
-
147
-
148
-
149
-
150
-
151
-
152
-
153
-
154
-
155
-
156
-
157
-
158
-
159
-
160
-
161
-
162
-
163
-
164
-
165
-
166
-
167
-
168
-
169
-
170
-
171
-
172
-
173
-
174
-
175
-
176
-
177
-
178
-
179
-
180
-
181
-
182
-
183
-
184
-
185
-
186
-
187
-
188
-
189
-
190
-
191
-
192
-
193
-
194
-
195
-
196
-
197
-
198
-
199
-
200
-
201
-
202
-
203
-
204
-
205
-
206
-
207
-
208
-
209
-
210
-
211
-
212
-
213
-
214
-
215
-
216
-
217
-
218
-
219
-
220
-
221
-
222
-
223
-
224
-
225
-
226
-
227
-
228
-
229
-
230
-
231
-
232
-
233
-
234
-
235
-
236
-
237
-
238
-
239
-
240
-
241
-
242
-
243
-
244
-
245
-
246
-
247
-
248
-
249
-
250
-
251
-
252
 |
 |

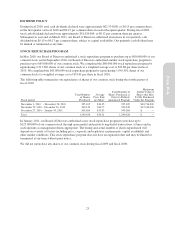
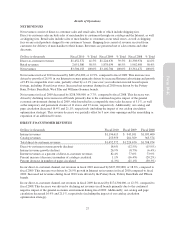
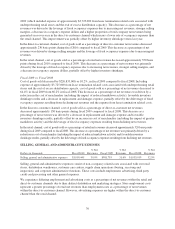
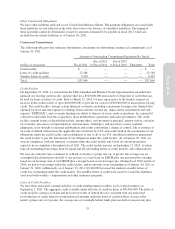
Net cash used in investing activities was $63,995,000 for fiscal 2010 compared to $71,230,000 in fiscal 2009.
Fiscal 2010 purchases of property and equipment were $61,906,000, comprised of $35,311,000 for systems
development projects (including e-commerce websites), $18,348,000 for 4 new and 7 remodeled or expanded
stores and $8,247,000 for distribution center and other infrastructure projects. Net cash used in investing
activities for fiscal 2010 decreased compared to fiscal 2009 primarily due to a reduction in purchases of property
and equipment resulting from a decrease in the number of new and remodeled stores we opened during fiscal
2010, as well as proceeds from the sale of assets, partially offset by restricted cash deposits.
Net cash used in investing activities was $71,230,000 for fiscal 2009 compared to $144,039,000 in fiscal 2008.
Fiscal 2009 purchases of property and equipment were $72,263,000, comprised of $40,717,000 for 9 new and 8
remodeled or expanded stores, $26,163,000 for systems development projects (including e-commerce websites)
and $5,383,000 for distribution center and other infrastructure projects. Net cash used in investing activities for
fiscal 2009 decreased compared to fiscal 2008 primarily due to a reduction in our purchases of property and
equipment resulting from a decrease in the number of new and remodeled stores we opened during fiscal 2009
and an overall reduction in all other capital expenditures, partially offset by proceeds received from the sale of a
corporate aircraft during fiscal 2008 that did not recur in fiscal 2009.
In fiscal 2011, we anticipate investing $135,000,000 to $150,000,000 in the purchase of property and equipment,
primarily for systems development projects (including e-commerce websites), the construction of 8 new stores
and 7 remodeled or expanded stores, and distribution center and other infrastructure projects.
For fiscal 2010, net cash used in financing activities was $178,315,000 compared to $55,498,000 in fiscal 2009.
Net cash used in financing activities in fiscal 2010 was primarily attributable to the repurchase of $125,000,000
of common stock and the payment of dividends of $59,160,000. Net cash used in financing activities in fiscal
2010 increased compared to fiscal 2009 primarily due to the repurchase of common stock.
For fiscal 2009, net cash used in financing activities was $55,498,000 compared to $52,160,000 in fiscal 2008.
Net cash used in financing activities in fiscal 2009 was primarily attributable to the payment of dividends and the
repayment of long-term obligations predominantly associated with the remaining outstanding balance on our
Mississippi industrial development bonds, partially offset by net proceeds from the exercise of stock-based
awards. Net cash used in financing activities in fiscal 2009 increased compared to fiscal 2008 primarily due to
the repayment of the remaining outstanding balance on our Mississippi industrial development bonds, partially
offset by net proceeds from the exercise of stock-based awards during fiscal 2009.
Dividend Policy
See section titled Dividend Policy within Part II, Item 5 of this Annual Report on Form 10-K for further information.
Stock Repurchase Program
See section titled Stock Repurchase Program within Part II, Item 5 of this Annual Report on Form 10-K for
further information.
33
Form 10-K