Pottery Barn 2010 Annual Report Download - page 63
Download and view the complete annual report
Please find page 63 of the 2010 Pottery Barn annual report below. You can navigate through the pages in the report by either clicking on the pages listed below, or by using the keyword search tool below to find specific information within the annual report.-
 1
1 -
2
-
3
-
4
-
5
-
6
-
7
-
8
-
9
-
10
-
11
-
12
-
13
-
14
-
15
-
16
-
17
-
18
-
19
-
20
-
21
-
22
-
23
-
24
-
25
-
26
-
27
-
28
-
29
-
30
-
31
-
32
-
33
-
34
-
35
-
36
-
37
-
38
-
39
-
40
-
41
-
42
-
43
-
44
-
45
-
46
-
47
-
48
-
49
-
50
-
51
-
52
-
 53
53 -
 54
54 -
 55
55 -
 56
56 -
 57
57 -
 58
58 -
 59
59 -
 60
60 -
 61
61 -
 62
62 -
 63
63 -
 64
64 -
 65
65 -
 66
66 -
 67
67 -
 68
68 -
 69
69 -
 70
70 -
 71
71 -
 72
72 -
 73
73 -
74
-
75
-
76
-
77
-
78
-
79
-
80
-
81
-
82
-
83
-
84
-
85
-
86
-
87
-
88
-
89
-
90
-
91
-
92
-
93
-
94
-
95
-
96
-
97
-
98
-
99
-
100
-
101
-
102
-
103
-
104
-
105
-
106
-
107
-
108
-
109
-
110
-
111
-
112
-
113
-
114
-
115
-
116
-
117
-
118
-
119
-
120
-
121
-
122
-
123
-
124
-
125
-
126
-
127
-
128
-
129
-
130
-
131
-
132
-
133
-
134
-
135
-
136
-
137
-
138
-
139
-
140
-
141
-
142
-
143
-
144
-
145
-
146
-
147
-
148
-
149
-
150
-
151
-
152
-
153
-
154
-
155
-
156
-
157
-
158
-
159
-
160
-
161
-
162
-
163
-
164
-
165
-
166
-
167
-
168
-
169
-
170
-
171
-
172
-
173
-
174
-
175
-
176
-
177
-
178
-
179
-
180
-
181
-
182
-
183
-
184
-
185
-
186
-
187
-
188
-
189
-
190
-
191
-
192
-
193
-
194
-
195
-
196
-
197
-
198
-
199
-
200
-
201
-
202
-
203
-
204
-
205
-
206
-
207
-
208
-
209
-
210
-
211
-
212
-
213
-
214
-
215
-
216
-
217
-
218
-
219
-
220
-
221
-
222
-
223
-
224
-
225
-
226
-
227
-
228
-
229
-
230
-
231
-
232
-
233
-
234
-
235
-
236
-
237
-
238
-
239
-
240
-
241
-
242
-
243
-
244
-
245
-
246
-
247
-
248
-
249
-
250
-
251
-
252
 |
 |

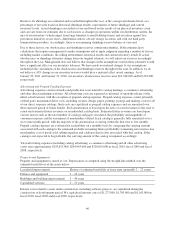
Stock-Based Compensation
We account for stock-based compensation arrangements by measuring and recording compensation expense in
our consolidated financial statements for all stock-based awards using a fair value method. For stock options and
stock-settled stock appreciation rights (“option awards”), fair value is determined using the Black-Scholes
valuation model, while restricted stock units are valued using the closing price of our stock on the date prior to
the date of grant. Significant factors affecting the fair value of option awards include the estimated future
volatility of our stock price and the estimated expected term until the option award is exercised or cancelled. The
fair value of the award is amortized over the requisite service period.
Foreign Currency Translation
As of January 30, 2011, we have 16 retail stores in Canada and limited operations in Europe and Asia, each of
which expose us to market risk associated with foreign currency exchange rate fluctuations.
Additionally, some of our foreign operations have a functional currency different than the U.S. dollar, such as in
Canada (functional currency of the Canadian Dollar) and in Europe (functional currency of the Euro). Assets and
liabilities are translated into U.S. dollars using the current exchange rates in effect at the balance sheet date,
while revenues and expenses are translated at the average exchange rates during the period. The resulting
translation adjustments are recorded as other comprehensive income within shareholders’ equity. Gains and
losses resulting from foreign currency transactions have not been significant and are included in selling, general
and administrative expenses.
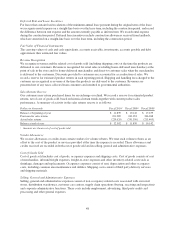
Earnings Per Share
Basic earnings per share is computed as net earnings divided by the weighted average number of common shares
outstanding for the period. Diluted earnings per share is computed as net earnings divided by the weighted
average number of common shares outstanding for the period plus common stock equivalents consisting of
shares subject to stock-based awards with exercise prices less than or equal to the average market price of our
common stock for the period, to the extent their inclusion would be dilutive.
Income Taxes
Income taxes are accounted for using the asset and liability method. Under this method, deferred income taxes
arise from temporary differences between the tax basis of assets and liabilities and their reported amounts in the
consolidated financial statements. We record reserves for estimates of probable settlements of foreign and
domestic tax audits. At any one time, many tax years are subject to audit by various taxing jurisdictions. The
results of these audits and negotiations with taxing authorities may affect the ultimate settlement of these issues.
Additionally, our effective tax rate in a given financial statement period may be materially impacted by changes
in the mix and level of our earnings.
49
Form 10-K