Pottery Barn 2010 Annual Report Download - page 72
Download and view the complete annual report
Please find page 72 of the 2010 Pottery Barn annual report below. You can navigate through the pages in the report by either clicking on the pages listed below, or by using the keyword search tool below to find specific information within the annual report.-
 1
1 -
2
-
3
-
4
-
5
-
6
-
7
-
8
-
9
-
10
-
11
-
12
-
13
-
14
-
15
-
16
-
17
-
18
-
19
-
20
-
21
-
22
-
23
-
24
-
25
-
26
-
27
-
28
-
29
-
30
-
31
-
32
-
33
-
34
-
35
-
36
-
37
-
38
-
39
-
40
-
41
-
42
-
43
-
44
-
45
-
46
-
47
-
48
-
49
-
50
-
51
-
52
-
53
-
54
-
55
-
56
-
57
-
58
-
59
-
60
-
61
-
 62
62 -
 63
63 -
 64
64 -
 65
65 -
 66
66 -
 67
67 -
 68
68 -
 69
69 -
 70
70 -
 71
71 -
 72
72 -
 73
73 -
 74
74 -
 75
75 -
 76
76 -
 77
77 -
 78
78 -
 79
79 -
 80
80 -
 81
81 -
 82
82 -
83
-
84
-
85
-
86
-
87
-
88
-
89
-
90
-
91
-
92
-
93
-
94
-
95
-
96
-
97
-
98
-
99
-
100
-
101
-
102
-
103
-
104
-
105
-
106
-
107
-
108
-
109
-
110
-
111
-
112
-
113
-
114
-
115
-
116
-
117
-
118
-
119
-
120
-
121
-
122
-
123
-
124
-
125
-
126
-
127
-
128
-
129
-
130
-
131
-
132
-
133
-
134
-
135
-
136
-
137
-
138
-
139
-
140
-
141
-
142
-
143
-
144
-
145
-
146
-
147
-
148
-
149
-
150
-
151
-
152
-
153
-
154
-
155
-
156
-
157
-
158
-
159
-
160
-
161
-
162
-
163
-
164
-
165
-
166
-
167
-
168
-
169
-
170
-
171
-
172
-
173
-
174
-
175
-
176
-
177
-
178
-
179
-
180
-
181
-
182
-
183
-
184
-
185
-
186
-
187
-
188
-
189
-
190
-
191
-
192
-
193
-
194
-
195
-
196
-
197
-
198
-
199
-
200
-
201
-
202
-
203
-
204
-
205
-
206
-
207
-
208
-
209
-
210
-
211
-
212
-
213
-
214
-
215
-
216
-
217
-
218
-
219
-
220
-
221
-
222
-
223
-
224
-
225
-
226
-
227
-
228
-
229
-
230
-
231
-
232
-
233
-
234
-
235
-
236
-
237
-
238
-
239
-
240
-
241
-
242
-
243
-
244
-
245
-
246
-
247
-
248
-
249
-
250
-
251
-
252
 |
 |

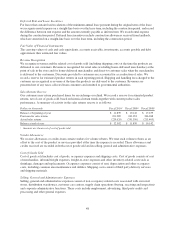
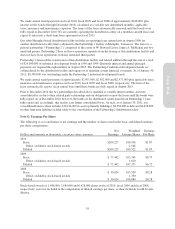
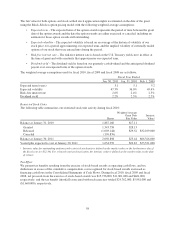
The fair value for both options and stock-settled stock appreciation rights is estimated on the date of the grant
using the Black-Scholes option pricing model with the following weighted-average assumptions:
•Expected term – The expected term of the option awards represents the period of time between the grant
date of the option awards and the date the option awards are either exercised or canceled, including an
estimate for those option awards still outstanding.
•Expected volatility – The expected volatility is based on an average of the historical volatility of our
stock price, for a period approximating our expected term, and the implied volatility of externally traded
options of our stock that were entered into during the period.
•Risk-free interest rate – The risk-free interest rate is based on the U.S. Treasury yield curve in effect at
the time of grant and with a maturity that approximates our expected term.
•Dividend yield – The dividend yield is based on our quarterly cash dividend and the anticipated dividend
payout over our expected term of the option awards.
The weighted average assumptions used for fiscal 2010, fiscal 2009 and fiscal 2008 are as follows:
Fiscal Year Ended
Jan. 30, 2011 Jan. 31, 2010 Feb. 1, 2009
Expected term (years) 5.1 5.1 5.2
Expected volatility 47.3% 56.0% 49.4%
Risk-free interest rate 2.6% 2.4% 2.5%
Dividend yield 2.2% 2.3% 2.7%
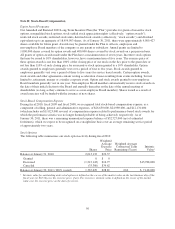
Restricted Stock Units
The following table summarizes our restricted stock unit activity during fiscal 2010:
Shares
Weighted Average
Grant Date
Fair Value
Intrinsic
Value1
Balance at January 31, 2010 1,887,160 $17.11
Granted 1,343,758 $28.13
Released (1,003,144) $29.52 $32,109,000
Canceled (176,876)
Balance at January 30, 2011 2,050,898 $23.44 $66,326,000
Vested plus expected to vest at January 30, 2011 1,654,959 $22.83 $53,521,000
1Intrinsic value for outstanding and unvested restricted stock units is defined as the market value on the last business day of
the fiscal year (or $32.34). For released restricted stock units, the intrinsic value is defined as the market value on the date
of release.
Tax Effect
We present tax benefits resulting from the exercise of stock-based awards as operating cash flows, and tax
deductions in excess of the cumulative compensation cost recognized for stock-based awards exercised as
financing cash flows in the Consolidated Statements of Cash Flows. During fiscal 2010, fiscal 2009 and fiscal
2008, net proceeds from the exercise of stock-based awards was $15,736,000, $11,861,000 and $461,000,
respectively, and the tax benefit (shortfall) associated with such exercises totaled $24,762,000, $5,981,000 and
($1,660,000), respectively.
58